
 Worksheets
Mesurement test review
Total questions: 135
Worksheet time: 4hrs 57mins

What is the length of the red line?
68 cm
6.8 cm
7 cm
7.2 cm

What is the length of the red line?
13 cm
13.2 cm
12.8 cm
12.5 cm

What is the length of the red line?
9.8 cm
9.6 cm
10.0 cm
10.2 cm
What is the basic unit used to measure length in the metric system?
meter
liter
gram
inch


What is the volume of the rock in the picture?
30 mL
40 mL
40 cm3
10 mL
Kilograms (Kg)
Which is the correct order of prefixes for the metric system?
kilo, hecto, deci, (base) unit, deca, milli, centi
kilo, deci, hecto, (base) unit, deca, milli, centi
kilo, hecto, (base) unit, deci, deca, milli, centi
kilo, hecto, deca, (base) unit, deci, centi, milli
What is a variable?
What is being measured during an experiment
The colors of the rainbow
a partially chewed packed of Skittles
What is Independent VARIABLE?
Variables that remain constant
A variable that is changed in an investigation.
A variable that is observed in an investigation.
What is Dependent VARIABLE?
Variables that remain constant
A variable that is changed in an investigation.
A variable that is observed in an investigation.
the Amount of MAtter in an object
Mass
Weight
Kilotons
Newtons
The Basic unit for measuring length in the Metric system
Meter
Liter
inches
yards
The unit for measuring volume in the Metric system
meter
Liter
Cup
Gallon
Which of these can be used to measure mass?
grams
kilograms
milligrams
centigrams
all of the above!
Which of these can be used to measure volume?
liters
milliliters
kiloliters
all of the above!

10 kilograms = _____ grams?
.10
100
1000
10000

1000 millimeters = ______ meters?
100000
10
1
.1

0.52 Km = _______mm
52
.052
520000
520

455.0 ml = _______ liters
45.5
4550.0
4.55
.455

What is the formula for the volume of a rectangle?
Length + Width + Height
Length / Width / Height
Length x Width x Height
Length - Width - Height

An object has a mass of 9.0 grams and a volume of 3.0 cm3. What is the density of the object?
3 g/cm3
27 g/cm3
9 grams
12 g/cm3

A block of metal is the shape of a cube. It is 2.0 cm on each side. What is the volume of the cube?
4cm3
8cm3
6cm3
2cm3

A solid piece of plastic has a density of 1.5g/cm3. Will it FLOAT or SINK in water?
Float
Sink

A solid piece of plastic has a density of 0.5 g/cm3. Will it SINK or FLOAT in water?
sink
float

A piece of wood has a density of 1.5g/cm3. Why will it SINK when placed in water?
It has less density than water.
It has the same density as water.
It has more density than water.

If we cut something in HALF, what happens to the density?
It stays the same.
It gets bigger.
It gets smaller.
It will be half as mcuh,

Why does warm air rise above cool air?
It has more density.
It has less density.
It weighs more.
It weighs less.

The diagram shown to the left represents a graduated cylinder containing water before and after a rock suspended on a string is lowered into it.
What is the approximate volume of the rock suspended in the graduated cylinder?
300 mL
50mL
100 mL
250 mL

The diagram to the left shows milk being poured into a measuring cup.
Which property of the milk can be directly measured using the cup?
volume
mass
density
solubility

The diagram to the left represents two cylinders. One hundred millimeters of a liquid was completely transferred from cylinder A to cylinder B.
Compared to the liquid that was in cylinder A, the liquid in cylinder B will have ...
the same mass and more volume
less mass and more volume
the same mass and the same volume
less mass and more volume

The diagram to the left represents a rock the was placed in a graduated cylinder containing 20 mL of water, causing the water level to rise.
Which physical property of the rock is being measured using the graduated cylinder?
mass
solubility
hardness
volume

What is the length of the paperclip in centimeters to the nearest tenth of a centimeter?
3 cm
4.0 cm
3.5 cm
3.8 cm

Th diagram to the left below shows a rock being placed in a graduated cylinder containing water. Use the displacement method to find the volume of the rock.
30 mL
20 mL
10 mL
5 mL

What is the most correct volume of the liquid shown in the graduated cylinder?
18 mL
15 mL
16 mL
17mL

Calculate the volume of the block of wood.
10.1 cm3
11.9 cm3
48.1 cm3
53.4 cm3

What is the total mass shown on the beams/riders of this triple beam balance?
36.8.g
356.6 g
536.8 g
506.8 g

Which instrument could be used to determine the volume of an irregularly shaped solid?
1
2
3
4

What is the length of the blue bar to the nearest 10th of a centimeter?
27 cm
28.3 cm
23 cm
27.3 cm

The diagram to the left shows a triple-beam balance.
What is the maximum mass, in grams, that could be measured by this balance?
500
1510
110
610
Which glassware would you NEVER use for making a measurement?
Beaker
Flask
test tube
graduated cylinder
Kg
gram
kilo
kilogram
1 cm= __ m
1
10
100

CO2 concentration

According to the pie chart, how much of a house's water usage is for showers?
26.7%
13.7%
21.7%
16.8%
What type of graph would you make to show how many of your classmates were born in each month of the year?
line
bar
circle
scatter plot

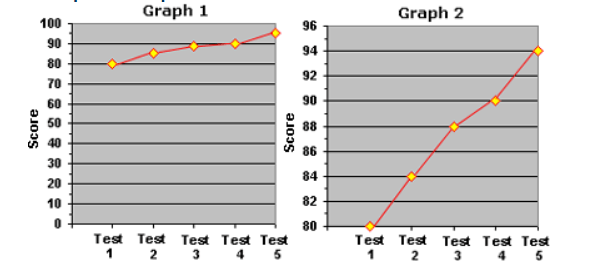
A sneaky student wants to impress his parents by showing them a graph of his performance progress on the last 5 science tests.
Which graph should he use to impress his parents?
Graph 1
Graph 2
Neither
Both
You want to make a graph for an experiment you did about plant growth over a two week period of time. What type of graph would you use?
Column graph
Line graph

What conclusions can you draw from this graph?
The deer population went down over time.
The deer population went up over time.
The dear population went up quickly, then down, but then stayed the same.
There are less dear because of hunters

The variable that is measured. It goes on the y-axis.
Independent Variable
Dependent Variable
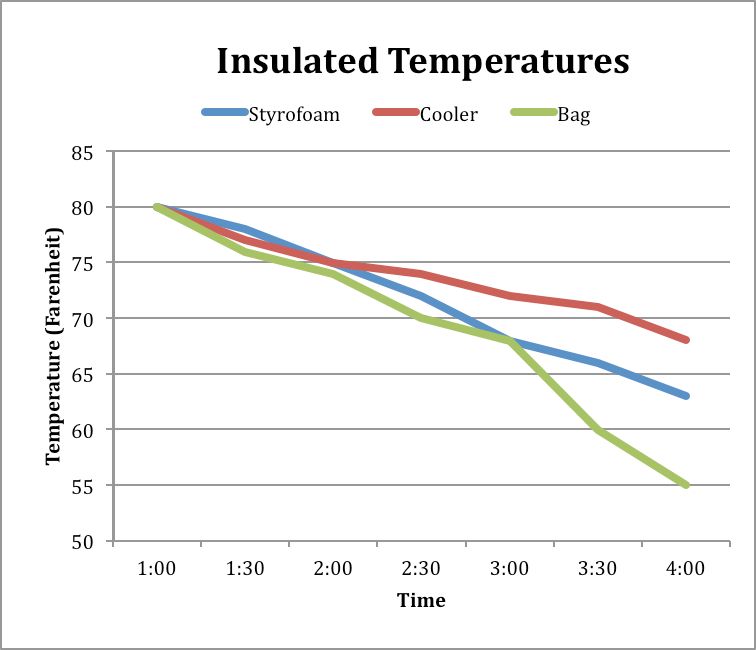
What data does this graph represent?
Change in temperature of a liquid over time in 3 different containers
How temperature can change the molecules in a material
The phase changes of a material
What type of container people use the most to store hot liquids.
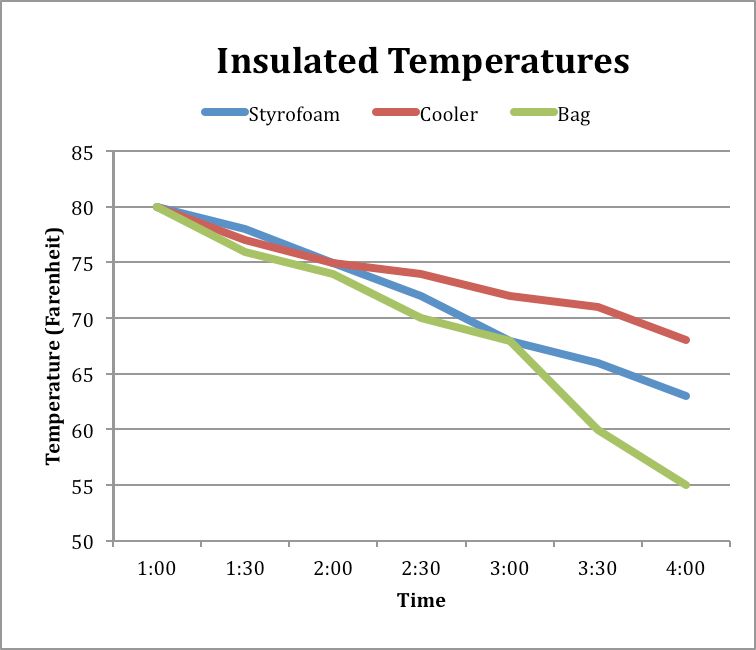
What was the temperature of the liquid in the Styrofoam container at 4:00?
55 degrees
68 degrees
73 degrees
63 degrees
1000 m = ___________ kilometers
5 cm= _______ mm
210 millimeters= _______ cm
2.1 cm
21 cm
210 cm
2100 cm
6 meters= ______ centimeters
60 cm
600 cm
6000 cm
0.6 cm
285 kg = ______g
285,000
285
2850
28,500

6 kg = _____ g
6
6000
600
.006

Based on the image, what is the mass of the object being measured?
500.10 grams
501.00 grams
510.00 grams
600 grams
You are determining the mass of an object using a triple beam balance. When the pointer is lined up with the zero mark, the riders show values of 300 grams, 20 grams, and 8.10 grams. What is the mass of the object?
272.10 grams
328.10 grams
439.10 grams
48000 grams

Based on the image, what can you infer about the mass of the object being measured
The mass is exactly 255.00 grams.
The mass is slightly less than 255 grams.
The mass is slightly more than 255 grams.
The mass is not exactly 255 grams, but it is impossible to tell whether the mass is greater than or less than 255 grams.
A weight used to measure mass on a triple beam balance
fulcrum
lever
rider
mass
An instrument that uses a set of three sliding riders to balance an unknown weight on the pan
spring scale
thermometer
triple beam balance
meter stick
The place where an object is placed to be measured is called ________
the pan
the bowl
the beam
the base
the scale of the beam in the back is from
0g - 10g
0g - 1000 g
0g- 100g
0g -500g
the scale of the beam in the front is from
0g - 10 g
0g - 100g
0g - 500g
10g - 100g
the scale of the beam in the middle is from
0g - 10g
10g - 500g
0g - 100g
0g - 500g
why do you have to "zero" a balance before using it?
to make sure all the measurements are accurate
a balance doesn't have to be zeroed
the balance comes with zero from the factory
you zero a balance after the weight has been placed on it

What is the volume of the water in this graduated cylinder?
10 mL
15 mL
12 mL
14 mL

What is the volume of the water in this graduated cylinder?
4 mL
9 mL
10 mL
8 mL

What is the volume of the water in this graduated cylinder? LOOK closely!
32 mL
33 mL
34 mL
35 mL

What is the volume of the water in this graduated cylinder?
17 mL
15 mL
20 mL
12 mL

Which object has the least volume?
the empty one
the button
the nail
the battery
the screw

What is the volume of the marble?
20 mL
17 mL
5 mL
3 mL

A measurement is something that has both a number and a ______
Unit
Symbol
Number
What two types of measurements make up DENSITY?
Volume and Weight
Temperature and Mass
Mass and Volume
What is the density of water?
34 g/mL
1 g/mL
29 g/mL
6 g/mL
What is the unit for density ?
g/ mL
g
gml
cm4


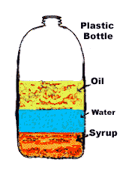

Which box has a higher density?
A
B
They are the same
How could two objects have different volumes, but still have the same mass?
If they both have the same density
If the larger object has a lower density
If the smaller object has a lower density
If the larger object has a higher density.

If all masses are 20g, which material has the GREATEST volume? (Volume = mass/density)
Oil
Kool-aid
Sprite
Vinegar

The mass of the jade is 13g, what is the density?
1.3 g/mL
0.81 g/mL
1.24 g/mL
0.77 g/mL

What is the same about the cubes?
Density
Weight
Mass
Volume

What is the volume of the cubes?
216 cm3
36 cm3
18 cm3
108 cm3

Can a single instrument measure density directly?
Yes, the graduated cylinder.
Yes, the scale.
Yes, a ruler.
No. You need mass and volume.


What is this graph showing you?
The worlds population has been growing and will continue to grow
The worlds population was growing but now is decreasing
The worlds population is staying the same

Between which two times was the greatest increase in number of shoppers?
11 AM to 12 PM
1 PM to 2 PM
12 PM to 1 PM

What is this graph showing?
The temperature of different volumes of water when boiling
The time it takes for various volumes of water to boil
The change in volume due to temperature change.

Assuming that the population growth of the bacteria continues, what would be a good prediction for the number of bacteria cells that will exist in 140 minutes?
0
40
100
2000
Which term describes the information that a scientist gathers during an investigation?
variable
observation
hypothesis
data
When should a pie chart be used?
When comparing parts of a whole
When showing change over time
When comparing data between different groups of categories
Whenever you want
When should a bar graph be used?
When comparing parts of a whole
When showing change over time
When comparing data between different groups of categories
Whenever you want
When should a line graph be used?
When comparing parts of a whole
When showing change over time
When comparing data between different groups of categories
Whenever you want

In August, how many metric tons did Clark's Paper Mill and Tyler Paper Mill produce altogether?
10
70
80
90

What is the main purpose of a line graph like this one?
to compare two things
to show changes and trends over time
to sort data into categories based on frequency
so you don't have to read words

You are measuring the temperature outside for your science class, the temperature is 96 degrees. What month do you predict it is?
September
July
May
December

What is this graph showing you?
The worlds population is staying the same.
The worlds population is going down (decreasing).
The worlds population was growing but now is decreasing.
The worlds population has been growing continuously.


