
 Worksheets
Honors Physics MP2 Mastery Recovery Review
Total questions: 101
Worksheet time: 2hrs 45mins
How close a measurement is to the accepted value is called..
Accuracy
Precision
Significant
Estimate




Which Student is the most Precise?
Alex
Shandra
Luis



Which Student is the most Precise?
Student A
Student B
Student C

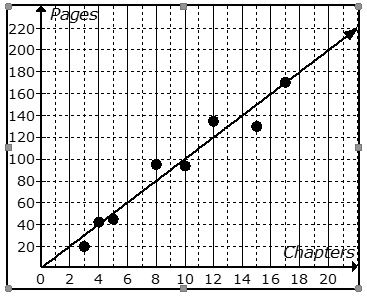


Mrs. Collins made a scatterplot to show the relationship between the number of absences and a student’s final exam score. Based on this scatterplot, a student with 6 absences should get approximately what score on the final exam?
85
92
70
76

What is the equation of the line of best fit
y= -2x + 10
y= 10x+ 2
y= 10

Which line is the best line of best fit?
a
b
c
i don't see any lines

The scatter plot shows the number coffee shops in different cities and the number of violent crimes. Which of the following is NOT true?
A) As the number of coffee shops increase, violent crimes appears to increase.
B) The line of best fit (regression line) shows a positive correlation
C) The data has a positive correlation coefficient
D) An increase in coffee shops causes an increase in violent crimes
The linear model to represent the distance (in miles) traveled given the time (in hours) driving is
m=−1.79+61.93h . Predict how far a person will travel driving 10 hours.617.51 miles
621.09 miles
100 miles
0.19 miles

Time Spent Watching TV & Grades
This measures how strong or weak the relationship between 2 quantitative variables are.
Scatter Plot
Causation
Correlation
Line of best fit


find line of best fit using calculator through these points (0,0)(1,2) (3,5) (6,7)
y=65x+7
y=1.14x+.64
y=1.5x+64
find line of best fit through these points
(1,3) (2,4) (5,8)
y=1.27x+1.615
y=2x+7
y=1.7x+8

Using the line of best fit, find the tire skid distance given that your speed was 100 mph.
370 feet
450 feet
250 feet
355 feet

Using the line of best fit, find the average given the maximum years is 30.
6.2
9.8
7.5
5.4

About how many points would we expect if Vasu played 40 minutes?
10
24
28
32

Which equations models the line on the graph in point-slope form, y−y1=m(x−x1) ? (Select two answers)
y−4=−21(x+1)
y−2=−21(x−3)
y+2=−2(x+3)
y−2=−2(x−3)
y+1=21(x−4)
Find a point on the line and the line's slope.
y−2=−31(x−5)
(5, 2), m= −31
(−5, −2), m= 31
(−5, −2), m= −31
(5, 2), m= 31

Match the following answers to the question.
Use the equation of the line of fit, y=1.81x+11.38 to answer the questions below.
For an increase of one hour time worked, what is the predicted increase in the amount of money spent on entertainment?
$1.81
What is the predicted amount of money spent on entertainment for a student who doesn't work any hours?
$11.38
What is the predicted amount of money spent on entertainment for a student who works 8 hours?
$25.86

The scatter plot shows the time spent studying, x, and the quiz score, y, for each of 25 students.
Using the points (0, 20) and (80, 90), write the equation of the line o best fit. Your slope should be in decimal form. Then predict the quiz score for a student who spent 50 minutes studying.
y=0.88x+20
A score of 64.
y=−0.88x+20
A score of 24.
y=−0.67x+20
A score of 14.
y=0.67x+20
A score of 54.

y = 1.67x + 375
y = 0.33x + 475
y = 1.67x + 3
y = 0.33x + 375

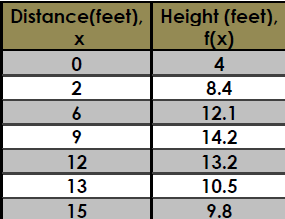

What equation best represents this data set?
{(−4, −5), (−3, −8), (−2, −9), (−1, −8), (0, −5), (1, 0.5)}
y=1.04x +4.84
y=1.04x−4.84
y=1.04x2+4.21x−4.84
y=1.04x2+4.21x+4.84
The accepted value for free-fall acceleration is 9.806 65 m/s2. Which of the following measurements is the most accurate?
9.808 60 m/s2
9.906 65 m/s2
8.806 77 m/s2
9.006 65 m/s2
How do you calculate slope?
x1-x2/y1-y2
y1-y2/x2-x1
y2-y1/x2-x1
x1/y1
What is a dependent variable?
things you can change in your experiment(x-axis)
thing you measure in your experiment (y-axis)
All aspects that are kept the same
things you can change in your experiment(y-axis)
What is an independent variable?
all variables that are kept the same(y-axis)
thing you can change in your experiment (x-axis)
thing you measure in your experiment (y-axis)
thing you measure in your experiment (x-axis)
A car is travelling at 25 km/hr eastward. Convert to centimeters per second. Round to the nearest 10s
250 cm/s
690 cm/s
100 cm/s
1,000 cm/s

Refer to the graph above. How would you describe the relationship above? Pick the most correct answer
As x increases, y decreases
As y increases, x increases
As x increases, y increases
As x decreases, y increases
Why do we create graphs?
To make it look interesting
Allow us to predict data that isn't measured
To make information easier to understand
To more easily notice trends
How many feet are in 5 meters?
(give final answer to nearest tenth, 1 decimal place)
16.4 feet
1.5 feet
16.405 feet
1.524 feet
How many meters are in 20 feet?
(select the answer rounded to a tenth, 1 decimal place)
65.62 meters
65.6 meters
6.0 meters
6.1 meters
Identify the conversion factor used to convert 6 hours into minutes.
6 hours60 min
60 min1 hour
1 hour60 min
1 min60 hours
100 cm = 1 m.
What conversion factor would be used to convert 120 centimeters into meters?
120 cm1 m
1 m100 cm
1 cm100 m
100 cm1 m
Identify the correct set up and conversion factor needed to convert 350 mL to liters (L).
1350 mL×1 L1000 mL
1350 mL×1000 L1 mL
1350 mL×1000 mL1 L
1350 mL×1 mL1000 L
Identify the correct set up and conversion factor needed to convert 42,758 g to kilograms (kg).
142,758 g×1 kg1000 g
142,758 g×1000 kg1 g
142,758 g×1 g1000 kg
142,758 g×1000 g1 kg
Define: Conversion Factor
A ratio used to convert from one unit of measurement to another.
A ratio used in math that tells you how many "things" you measured.
A ratio that allows you to measure more accurately.
A ratio that tells you how many inches are in one foot.
Which of the following is the correct formula to find absolute percent error
|measured - accepted|
measured - accepted
accepted - measured
accepted∣measured −accepted∣x 100%
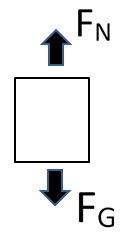
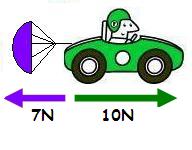
Which of the following is true about this free-body diagram?
the forces are are balanced
the object is free-falling
the object is moving upward
the forces are unbalanced

The force exerted on a hanging object by strings, ropes, and chains is called
tension
normal
elastic
mechanical

The forces on this chandelier are...
Gravity
Gravity and Normal
Gravity and Tension
Gravity, Tension, Friction, and Applied

A chandelier is hanging from the ceiling. If the force of gravity on the chandelier is 120 N, the force of tension must be ...
0 N
12 N
60 N
120 N
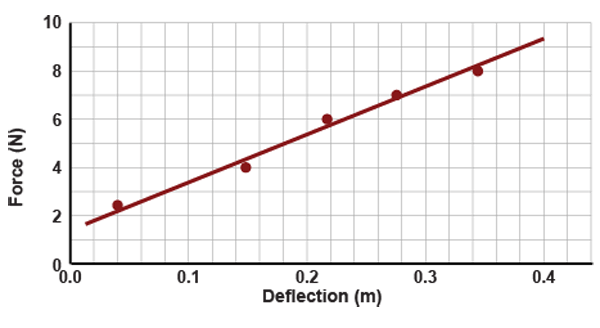
Spring constant is measured in
N
N/m
m
What is the correct equation for Hooke's Law?
F=mgk
F=ma
F=kΔx
F=Δxk
Which 2 answers provide the best definition of the value 'k'?
k is the stiffness coefficient
k is the spring constant
k is the specific spring number
k is the kinetic energy needed to stretch the spring
How may one graph a function in the TI-84 calculator?
Type the function appropriately in "y=", then press "graph".
Using the home screen, enter the function, then press "enter".
Go to "STAT" mode, enter the function appropriately, then press "enter".
In order to activate a function or character that is shown in blue on the calculator panel, which of the following options must one press first?
"2nd" .
"ALPHA"
"APPS"
"STAT"
Which of the following ways may be used to reset the TI-84?
Press the reset button on the back of the calculator.
Press "2nd", "+", "7", "1", then "2".
Turn the calculator off, then turn it back on.
Press "CLEAR" or "QUIT".
Graph the equation y=x2+4x−5 on your TI-84 graphing calculator.
What are the coordinates of the vertex?
(-2, -8)
(-2 , -9)
(-1, -8)
(-1, -9)
There are several steps in finding the linear regression on a TI-84 calculator, also known as a line of best fit, or trend line. Select all of the steps below that apply.
Click the MODE button and turn ON StatDiagnostics
Press the (-) button
Go to STAT Button. Select Enter, x values in L1, y values L2
Press STAT button, Arrow over to CALC, Press #8 for LinReg
Press * then Enter

Which with is the line of best fit?
A) Black
B) Orange
C) Red
D) Blue
In a science investigation, Evelyn, Ethan, and Kai are trying to identify outliers in a scatterplot of the relationship between the number of hours spent studying and test scores. How can they identify outliers in the scatterplot?
By identifying data points that are similar to the main cluster of points.
By observing data points that are significantly distant from the main cluster of points.
By looking for data points that are close to the main cluster of points.
By focusing on data points that are located in the center of the scatterplot.
Grace, David, and Mason are studying the correlation between the number of hours studied and the grades obtained by students. How can they determine the strength of this correlation using a scatterplot?
By counting the number of data points in the scatterplot.
By calculating the average of the data points in the scatterplot.
By measuring the size of the data points in the scatterplot.
By examining the closeness of the data points to a straight line of best fit.
Benjamin, Harper, and Maya are working on a science investigation where they have to represent data. What are the advantages of them using a scatterplot to represent their data?
Scatterplots provide a clear visual representation of data.
Scatterplots help visualize relationships and patterns in data.
Scatterplots allow for easy identification of outliers.
Scatterplots make it easier to understand complex data.
The factors that remain the same in an experiment are known as -----.
Variables
Controls
Constants
Trials
The title of an experiment and/or graph should contain both the ----- and ----.
Indpendent variable and Summary
Conclusion and Summary
Dependent variable and Independent variable
Dependent variable and Conclusion
The --- variable is located on the x-axis.
Independent
Dependent

This type of graph displays data as unconnected points that show a relationship between two sets of data.
Histogram
Circle graph
Frequency Table
Scatterplot
The --- variable is found on the y-axis.
Dependent
Independent

What are the correct coordinates for point S?
(-4,6)
(6,-4)
(1,-3)
(4,6)
What are the correct coordinates for point Y?
(5,-3)
(-3,5)
(3,5)
(5,3)
OOPS! You were typing something in and missed a number. How do you insert it into your calculator WITHOUT CLEARING EVERYTHING?
You just arrow over and type it in. You do not have to retype anything.
You press 2nd-Del to get to "insert"
You have to clear it. There is no other way
y = x2 - 2x - 8
Minimum or Maximum?
Max
y = 8
Min
y = -8
Max
y = 9
Min
y = -9

