wayground logo

Free Printable Worksheets

Font size

S
M
L
XL
Worksheets

ACT Prep Week- Science

Total questions: 36

Worksheet time: 53mins

Name
Class
Date
1.
A student wants to test the effects of type of exercise on heart rate.  What would be a proper hypothesis?
a)
If type of exercise affects the heart rate of a person, then jumping jacks will increase the heart rate the most
b)
Jumping jacks will cause the highest heart rate
c)
Exercise increases heart rate
d)
If exercise affects heart rate, jumping jacks will increase heart rate the most
2.
A student wants to test the effects of type of exercise on heart rate.  What would be a good experimental group?
a)
jumping jacks, push-ups, sit-ups, jogging in place, lunges
b)
standing heart rate
3.
On which axis would you place the independent variable?
a)
X
b)
Y
c)
Z
4.
On which axis would you place the dependent variable?
a)
X
b)
Y
c)
Z
5.
Which Continent has the smallest % of wild cats?
a)
Asia
b)
Europe
c)
North America
d)
South America
6.

Look at the Bar Graph "Student Grades". Which grade did the smallest number of students get?

a)

A

b)

B

c)

C

d)

D

7.
Which pizzeria has the second largest sales? 
a)
Pizza House
b)
Domiano's Pizza
c)
Little Secrets Pizza
d)
Uncle John's Pizza
8.

Which day of the week had the lowest temperature?

a)

Monday

b)

Thursday

c)

Tuesday

d)

Wednesday

9.

How many more people like purple than red?

a)

3

b)

5

c)

7

d)

9

10.

Which day had more minutes of homework?

a)

Wednesday

b)

Thursday

c)

Friday

11.

The variable that responds to the changes in the other variable is the ___ variable.

a)

Independent

b)

Dependent

c)

Constant

d)

Control

12.

What is the independent variable on this graph?

a)

Year

b)

Number of Visitors

c)

Visitors to a Park

d)

none of these

13.

What is the dependent variable on this graph?

a)

Year

b)

Number of Visitors

c)

none of these

14.
In which year did exactly 60 students have scholarships?
a)
2010
b)
2011
c)
2012
d)
2013
15.
In August, how many metric tons did Clark's Paper Mill and Tyler Paper Mill produce all together?
a)
10
b)
70
c)
80
d)
90
16.
After the refrigerator, which appliance is used the most on weekdays?
a)
Television
b)
Heater
c)
Lights
d)
Computer
17.
Which appliance is used twice as many hours on the weekends as it is on weekdays?
a)
Lights
b)
Computer
c)
Refrigerator
d)
Television
18.
What is this graph showing you?
a)
The worlds population is staying the same.
b)
The worlds population is going down (decreasing).
c)
The worlds population was growing but now is decreasing.
d)
The worlds population has been growing and will continue to grow. 
19.

Which month had the biggest difference between the high and low temperatures?

a)

January

b)

April

c)

October

d)

November

20.
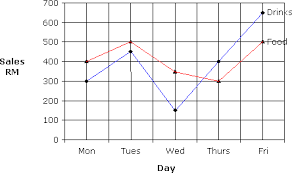
People buy more drinks on ____ than any other day.
a)
Monday
b)
Tuesday
c)
Thursday
d)
Friday
21.

The graph shows the number of inches a plant grew each week.

Between which 2 weeks did the plant grow the MOST?

a)

Week 1 and Week 2

b)

Week 2 and Week 3

c)

Week 3 and Week 4

d)

Week 4 and Week 5

22.
About when is the ball 900 cm high?
a)
0 second
b)
0.2 seconds
c)
0.5 seconds
d)
0.9 seconds
23.
Here distance stands for Bill's distance from Ridgewood. When was Bill furthest from Ridgewood?
a)
1 second
b)
2 seconds
c)
4 seconds
d)
5 seconds
24.

The graph shows the relationship between pressure and the depth in the earth's layers as rock is formed. Which statement summarizes the cause-and-effect relationship that the graph shows?

a)

As the amount of pressure increases, the depth decreases

b)

As the amount of pressure decreases, the deph increases

c)

As the amount of pressure increases, the depth increases

d)

As the amount of pressure decreases, the depth remains the same

25.

What is being kept the same throughout the experiment (constant)?

a)

Ramp height

b)

Speed the ball rolls

c)

Type of ball

26.
A 5 kg bowling ball, a 0.25 kg baseball, and a 0.05 kg golf ball are dropped from a 100-meter high building. A camera catches the motion of the balls as they pass specific markers (in meters, m) on the building. The times (in seconds, s) that each object passes the markers are listed in the table below. Which of the following conclusions is true?
a)
Light objects fall faster than heavy ones.
b)
All objects fall at the same rate regardless of mass.
c)
Heavy objects fall faster than light ones.
d)
Objects of different shapes fall at the same rate
27.
Tony recorded data from his chemistry experiment in the following table.  Which of the categories from Tony's data table includes qualitative observations?
a)
color
b)
temperature
c)
mass
d)
volume
28.
Inferences are
a)
never made by scientists.
b)
questions that are made by studying conclusions or predictions.
c)
conclusions or predictions that are made by studying observations.
d)
exactly the same as observations
29.
The level of closeness between multiple measurements of the same quantity is called __________.
a)
accuracy
b)
similarity
c)
precision
d)
congruence
30.
The pictures below show a field that is being studied over time. In the field, there are rabbits (red circles) and foxes (blue circles). What conclusion can be drawn from these observations?
a)
The number of foxes decreases as the number of rabbits increases.
b)
The number of rabbits and foxes remains constant over time.
c)
The number of foxes remains constant while the number of rabbits decreases.
d)
The number of foxes increases while the number of rabbits decreases.
31.
Trent placed a frozen pizza in the microwave. After 30 seconds, the pizza was still frozen. After 60 seconds, the pizza was thawed but still cold. The pizza was finally ready to eat after 120 seconds.
Based on his observations, what can Trent infer about microwaves?
 A.P. B.TC.T D.
a)
izzas taste better when they are cooked in an oven rather than a microwave.
b)
The longer food is cooked in a microwave, the more its temperature increases. 
c)
he longer food is cooked in a microwave, the more its temperature decreases.
d)
Pizzas take longer to cook in the microwave than hot dogs.
32.
Sean enjoys studying the stars. He used a photometry tool to calculate several stars' apparent magnitudes (how bright a star looks in the sky). He then researched the stars' distances from Earth. He recorded his results in the table below.
What conclusions can Sean draw from his chart?
a)
A star's apparent magnitude increases as its distance from Earth increases.
b)
A star's apparent magnitude decreases as its distance from Earth increases.
c)
A star's apparent magnitude decreases if it is very close to another star.
d)
A star's apparent magnitude is not directly related to its distance from Earth.
33.
A scientist is studying which flower color attracts the most bees. To do this, the scientist releases a group of ten honey bees into a chamber with white walls. The chamber contains potted flowers of the following varieties: yellow daffodils, red roses, white daisies, purple asters, and orange lilies.
The results of the experiment is shown in the table below:
From the data, the scientist concludes that bees prefer red flowers. Are the scientist's conclusions valid? 
a)
Yes, the honey bees visited the red roses 34 times during the experiment, which was 4 more times than the next popular flower, the orange lily.
b)
Yes, bees are always attracted to the brightest colored flower, which is why there are very few kinds of white flowers.
c)
No, the honey bees showed relatively the same interest in all of the flowers except the daffodils.
d)
Not necessarily; the honey bees may have been attracted to traits other than flower color.
34.
Mary thought that the number of frogs in the neighborhood pond had decreased over the last few years. So, she decided to count the number of frogs she saw around the pond twice each day for ten days. Mary's data is displayed in the table below. Based on her observations, which of the following can Mary infer? 
a)
Frogs are consumed by predators in the morning and are reborn in the evening.
b)
The number of frogs at the pond has steadily declined over the last 2 years.
c)
The number of frogs at the pond has steadily increased over the last 2 years.
d)
Frogs rest during the afternoon and become more active in the evening.
35.

A scientist claimed that paleo wildfires could only have occurred when the %O2 was higher than 15. For which of the following time intervals during the Mesozoic era are the data in Figure 1 inconsistent with this claim?

a)

250-230 mya

b)

180-160 mya

c)

120-100 mya

d)

90-70 mya

36.

Select all answer choices that indicate types of passages on the SCIENCE test.

a)

Conflicting Viewpoint

b)

Understanding Graphs

c)

Research Summary

d)

Data Representation

e)

Earth Science