
 Worksheets
Unit 3 extra questions
Total questions: 151
Worksheet time: 3hrs 54mins
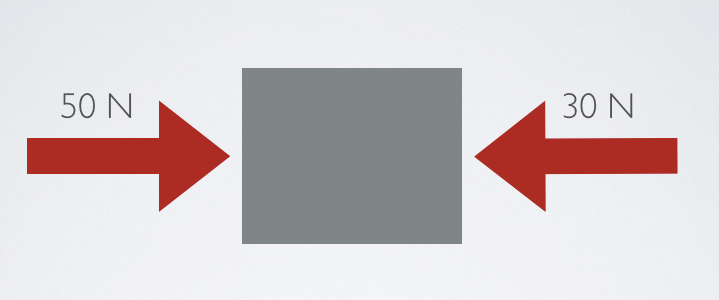


These forces are...
Balanced
Unbalanced

These forces are...
Balanced
Unbalanced

These forces are...
Balanced
Unbalanced

The net force is...
50 N
0 N
100 N
2500 N

The net force is...
-20 N
0 N
80 N
20 N


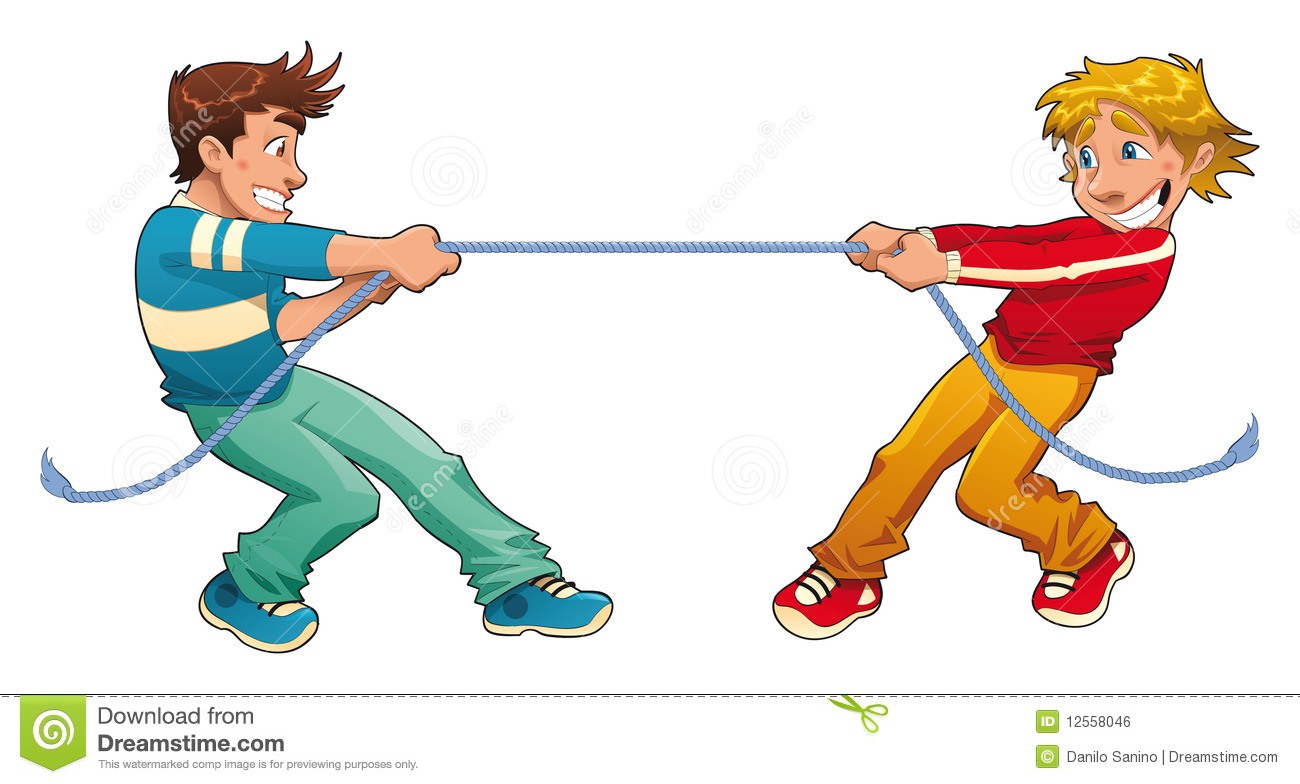
What is true about this image?
It shows unbalance forces.
It shows balanced forces.
The people on the right are winning.
The people on the left are winning.

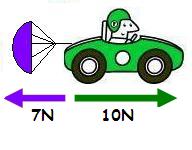
What is true about this picture?
the forces are balanced
the net force is 10N
The net force is 3 N
The net force is 7N

The hockey puck is moving at a constant velocity across the ice. What forces does the puck experience at this moment?
None
Gravity
Gravity and Normal
Gravity, Normal, and Friction
Gravity, Normal, Friction, and Applied

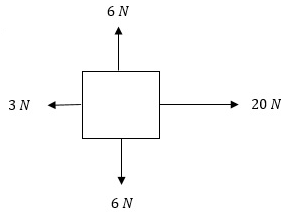
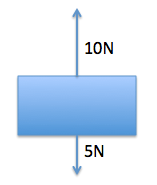
What is the NET FORCE of this diagram?
17 N, right
17 N, left
23 N, right
12 N, up

Determine the net force and direction of motion:
16 N Right
16 N Left
0 N not moving
0 N left
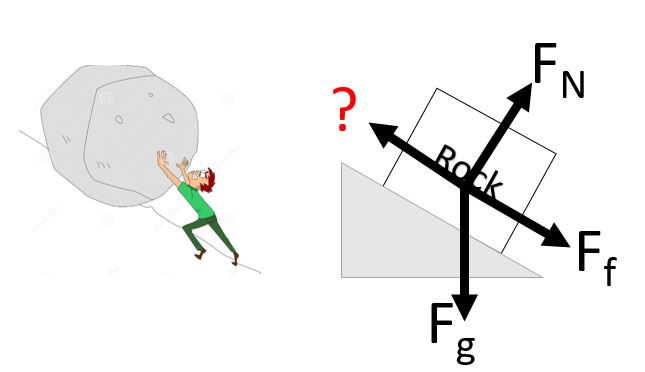

If two forces are opposite each other on a free body diagram you should...
Multiply them together
Divide them into each other
Subtract them from each other
Add them together

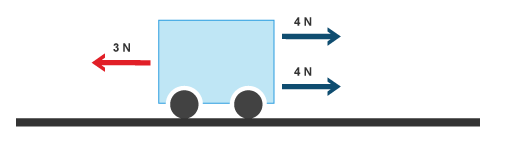


A baseball is thrown a distance of 50 meters. What is the speed if it takes 2 seconds to cover that distance? s=d/t
100 m/s2
25 m/s2
52 m/s2
100 seconds

What motion does this graph show?
Constant slow motion
Acceleration
Constant fast motion
Deceleration

What motion does this graph show?
Constant speed
Deceleration
Acceleration
changing motion

What motion does this graph show?
Deceleration
Constant speed
Going up a hil
Acceleration

What motion does this graph show?
Constant speed
No motion
Acceleration
Constant velocity

What motion does this graph show?
Deceleration
Constant speed
Positive Acceleration
An object returning to the starting location

What motion does this graph show?
No motion
Acceleration
Constant speed
Deceleration

What motion does this graph show?
Returning to start
Constant speed
No motion
Deceleration

What motion does this graph show?
Acceleration
Constant speed
Negative speed
Returning to start

What motion does this graph show?
An object that has constant speed
An object that is stopped
An object that is accelerating
An object that is returning to start
Find the two graphs that show acceleration.


Find the two graphs that show constant speed.


Find the two graphs that show deceleration.


Find the two graphs that show no motion.


Find all of the graphs that show a change in speed.


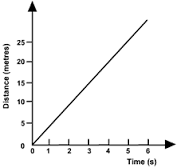
What is this graph showing?
The object is moving away from starting point at a constant speed
The object is moving back towards the starting point at a constant speed
The object is increasing its velocity
The object is decreasing its velocity

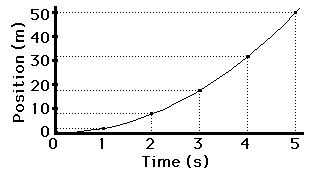
The picture of the position vs. time graph shows an object that is...
speeding up
moving at a constant speed
not moving
slowing down.


What does either line on this graph represent?
Constant Speed
Speeding up
Not moving

What does a negative sloped line mean on a position vs time graph?
The object is not moving at all
The object is slowing down.
The object is moving at a constant back to where it started.

Which best describes this motion in the graph?
stopped, walking, running home
running, walking, stopped, walking home
walking, stopped, walking, running home
walking, running, running, stopped

Which segment shows the faster speed?
A to B
C to D
B to C
E to F


Use the graph above and pick the most accurate description of the object's motion
object is moving at constant speed
object is speeding up
object is at rest
object is slowing down

Use the picture above to choose the most accurate description of the object's motion
object is at rest
object is slowing down
object is moving at a constant speed
object is speeding up

Describe the velocity in this graph.
constant and positive
constant and negative
decreasing
increasing

C to D
E to F
G to H


all of these

at rest

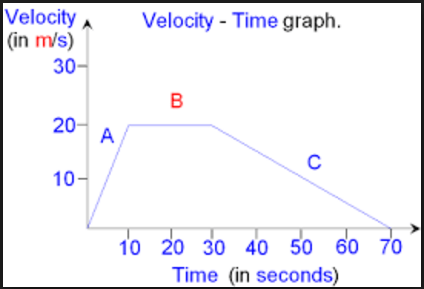
Describe the motion on this speed/ time graph.
accelerates... then goes constant speed... then accelerates again
goes constant speed... stops... goes constant speed


Describe the motion in the graph:
Constant Speed (positive slope)
Stopped (at rest)
Acceleration (increasing speed)
Return Home (negative slope)

Describe the motion in the graph:
Constant Speed (positive slope)
Stopped (at rest)
Acceleration (increasing speed)
Return Home (negative slope)

Describe the motion in the graph:
Constant Speed (positive slope)
Stopped (at rest)
Acceleration (increasing speed)
Return Home (negative slope)

Describe the motion in the graph:
Constant Speed (positive slope)
Stopped (at rest)
Acceleration (increasing speed)
Return Home (negative slope)

Describe the motion in the graph:
Constant Speed (positive slope)
Stopped (at rest)
Acceleration (increasing speed)
Return Home (negative slope)

Describe the motion in the graph:
Constant Speed (positive slope)
Stopped (at rest)
Acceleration (increasing speed)
Return Home (negative slope)

Describe the motion in the graph:
Constant Speed (positive slope)
Stopped (at rest)
Acceleration (increasing speed)
Return Home (negative slope)

Describe the motion in the graph:
Constant Speed (positive slope)
Stopped (at rest)
Acceleration (increasing speed)
Return Home (negative slope)

Describe the motion in the graph:
Constant Speed (positive slope)
Stopped (at rest)
Acceleration (increasing speed)
Return Home (negative slope)

Describe the motion in the graph:
Constant Speed (positive slope)
Stopped (at rest)
Acceleration (increasing speed)
Return Home (negative slope)

Describe the motion in the graph:
Constant Speed (positive slope)
Stopped (at rest)
Acceleration (increasing speed)
Return Home (negative slope)

Describe the motion in the graph:
Constant Speed (positive slope)
Stopped (at rest)
Acceleration (increasing speed)
Return Home (negative slope)


A bicyclist takes a curved, scenic ride through the park going 4.5 m/s. This describes ___.
Speed
Acceleration
Velocity


What is occurring from point A to point B?
While going to school, a student walks an average of 5 km/hr west for 12 blocks. This describes ___.
Speed
Acceleration
Velocity
An airplane flying northwest at 500 mph takes a turn, and flies west. This describes ___.
Speed
Velocity
Acceleration

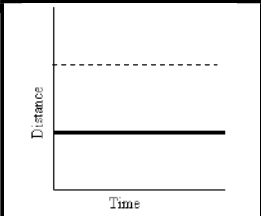
This is a distance/ time graph. What does this graph represent?
Constant Speed
Acceleration
Not moving
How quickly velocity is changing is ______.
Velocity
Speed
Displacement
Acceleration

This is a distance/ time graph. What does this graph represent?
Constant speed
Acceleration
Not moving

This is a distance/ time graph. What is happening at D?
Stationary
Accelerating
Fast steady speed; moving away from the starting position
Slower steady speed; moving away from the starting position

This is a distance/ time graph. What is happening at E?
Stationary
Accelerating
Fast steady speed; moving away from the starting position
Steady speed; returning to start position

This is a distance/ time graph. What is happening at A?
Stationary
Accelerating
Slower steady speed; moving away from the starting position
Steady speed; returning to start position

This is a distance/ time graph. What is happening at B?
Stationary
Accelerating
Slower steady speed; moving away from the starting position
Steady speed; returning to start position


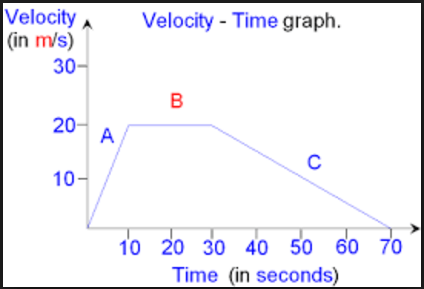
This is a velocity/ time graph. Describe the motion of the object at point C.
The object is speeding up.
The object is decelerating.
The object is moving at a constant speed.
The object is moving closer to the starting point.
This is a velocity/ time graph. Describe the motion of the object at point A.
The object is speeding up.
The object is decelerating.
The object is moving at a constant speed.
The object is moving farther away from the starting point.
This is a velocity/ time graph. Describe the motion of the object at point B.
The object is speeding up.
The object is decelerating.
The object is moving at a constant speed.
The object is not moving.
This is a velocity/ time graph. Describe the motion of the object at point D.
The object is speeding up.
The object is decelerating.
The object is moving at a constant speed.
The rate of acceleration is changing.
Mary is ridding at a constant speed on a mini train at the amusement park ride. The train goes around a circular track 5 times before the ride is over. Is Mary accelerating?
Yes she is accelerating because she is changing directions.
No she is not accelerating because she is moving at a constant speed.
No she is not accelerating because her velocity is changing.

Calculate the speed of each car. s=d/t
Red: 5 km/h Blue: 2 km/h
Red: 200 km/h Blue: 250 km/h
Red: 40 km/h Blue: 125 km/h
Red: 125 km/h Blue: 40 km/h
What is the speed of an object that travels 100 meters in 5 seconds?
500 m/s
20 m/s
0.5 m/s
20 mph
How long will it take a car driving at 50 mph to travel 100 miles?
150 hours
0.5 hours
500 miles
2 hours
How quickly velocity is changing is ______.
Velocity
Speed
Displacement
Acceleration
This is a distance/ time graph. What does this graph represent?
Constant speed
Acceleration
Not moving

What is happening on the graph from 4-5 seconds?
The car is slowing down.
The car is moving the fastest.
The car is stopping.
Not enough information is given.

On this velocity/ time graph where is the object accelerating?
B-C
D-E
E-F
None of these
On this velocity/ time graph where is the object not moving?
B-C
C-D
E-F
None of these

