
15 Q
11th - Uni
20 Q
11th - Uni
10 Q
9th - 12th
17 Q
8th
22 Q
Uni
13 Q
9th - 12th
14 Q
12th
13 Q
8th
14 Q
8th
14 Q
12th - Uni
11 Q
6th
16 Q
9th - 12th
11 Q
9th - 12th
18 Q
KG
16 Q
12th
26 Q
9th - Uni
33 Q
9th - 12th
20 Q
12th
15 Q
12th - Uni
35 Q
8th
21 Q
11th
20 Q
3rd - Uni
16 Q
9th
20 Q
9th - 12th
Explore Worksheets by Subjects
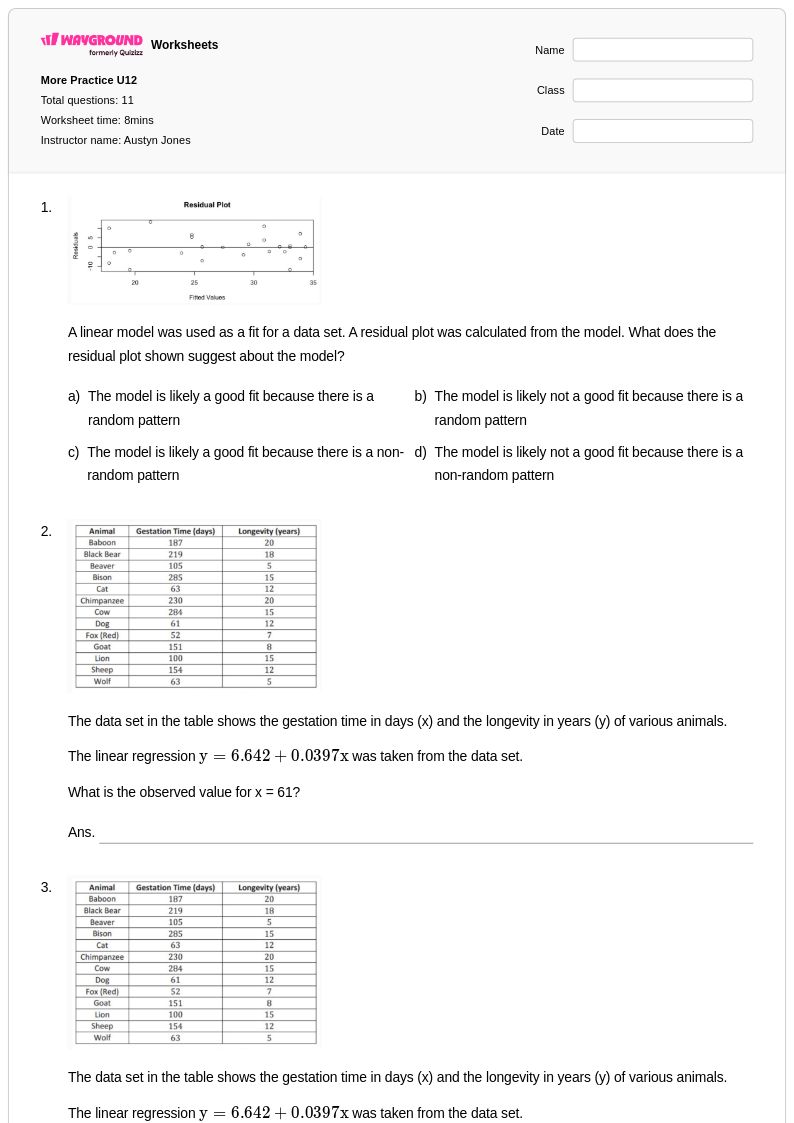
Explore printable Residual Plots worksheets
Residual plots worksheets available through Wayground (formerly Quizizz) provide comprehensive practice materials designed to strengthen students' understanding of regression analysis and statistical modeling. These carefully crafted printables focus on developing critical skills in interpreting scatter plots of residuals, identifying patterns that indicate model appropriateness, and recognizing violations of regression assumptions such as non-linearity, heteroscedasticity, and outliers. Students work through practice problems that require them to analyze residual versus fitted value plots, assess randomness in residual distributions, and draw conclusions about model validity. Each worksheet includes detailed answer keys that guide learners through proper interpretation techniques, while the free pdf format ensures accessibility for both classroom instruction and independent study.
Wayground (formerly Quizizz) supports mathematics educators with millions of teacher-created resources specifically targeting residual plot analysis and broader statistical concepts. The platform's robust search and filtering capabilities enable instructors to locate worksheets aligned with specific curriculum standards, while differentiation tools allow for seamless customization based on student proficiency levels. Teachers can access materials in both printable and digital pdf formats, facilitating flexible implementation across various learning environments. These comprehensive worksheet collections prove invaluable for lesson planning, targeted remediation of statistical reasoning gaps, enrichment activities for advanced learners, and systematic skill practice that builds confidence in interpreting complex statistical graphics and drawing appropriate conclusions from regression analyses.