
10 Q
9th - 12th
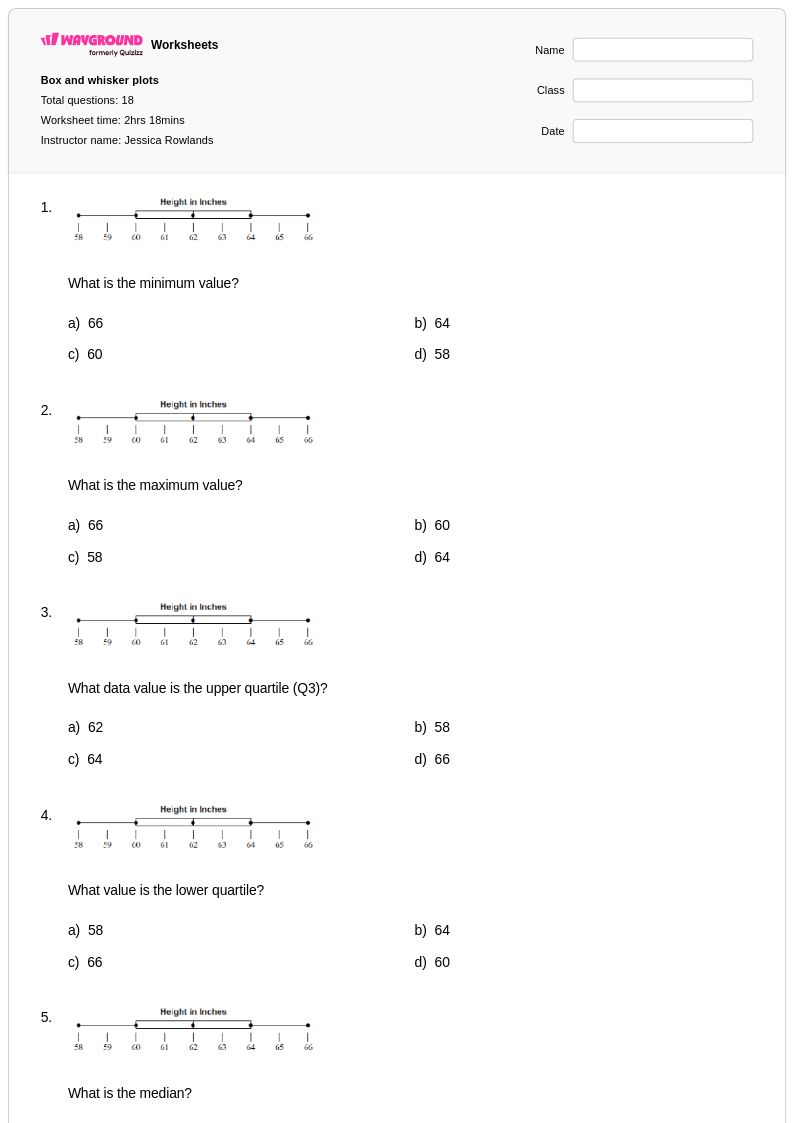
18 Q
9th - 12th
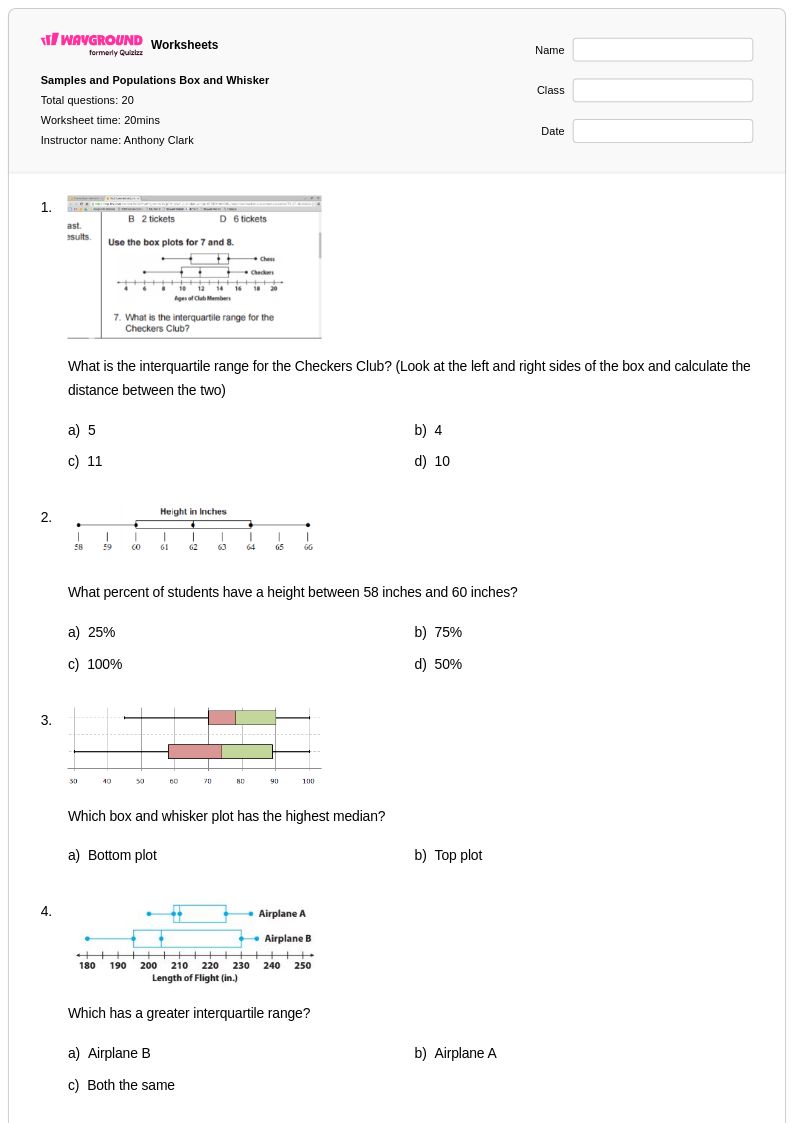
20 Q
7th - 10th
25 Q
10th
10 Q
9th - 11th
16 Q
10th - 12th
25 Q
9th - 12th
42 Q
9th - 12th
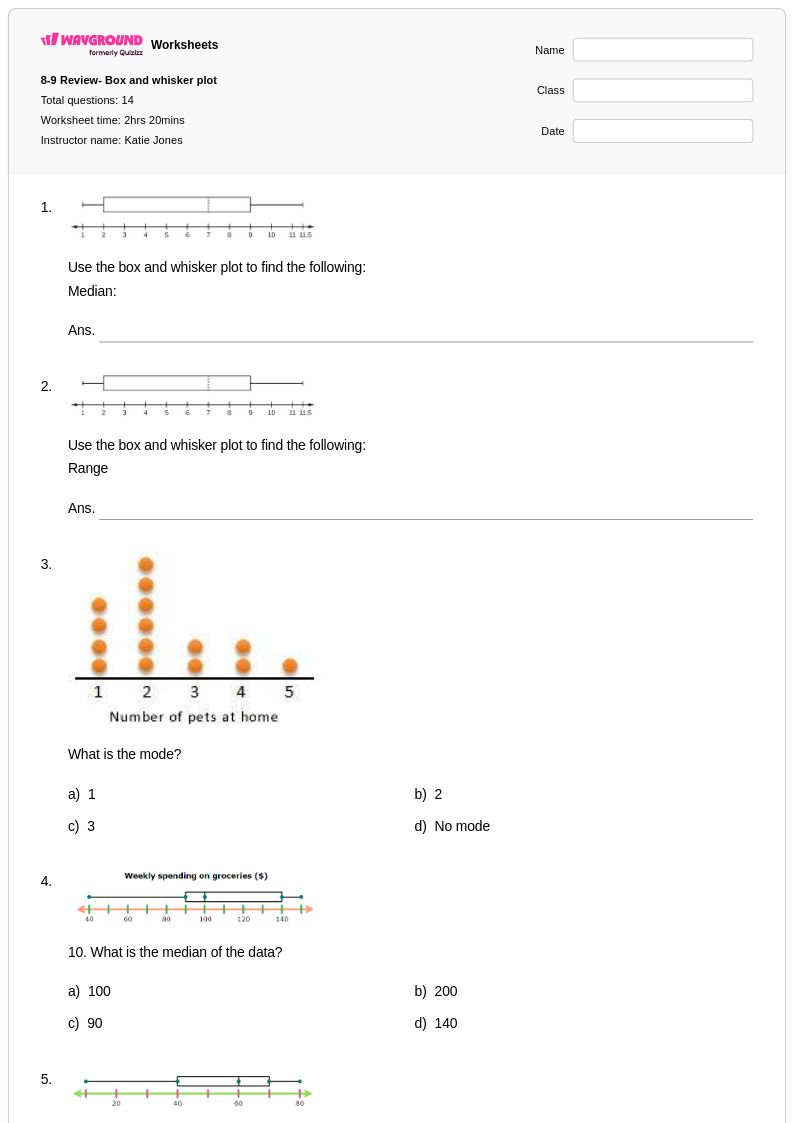
14 Q
9th - 12th

11 Q
10th
35 Q
9th - 12th
25 Q
10th
9 Q
9th - 10th
18 Q
8th - Uni
20 Q
7th - Uni
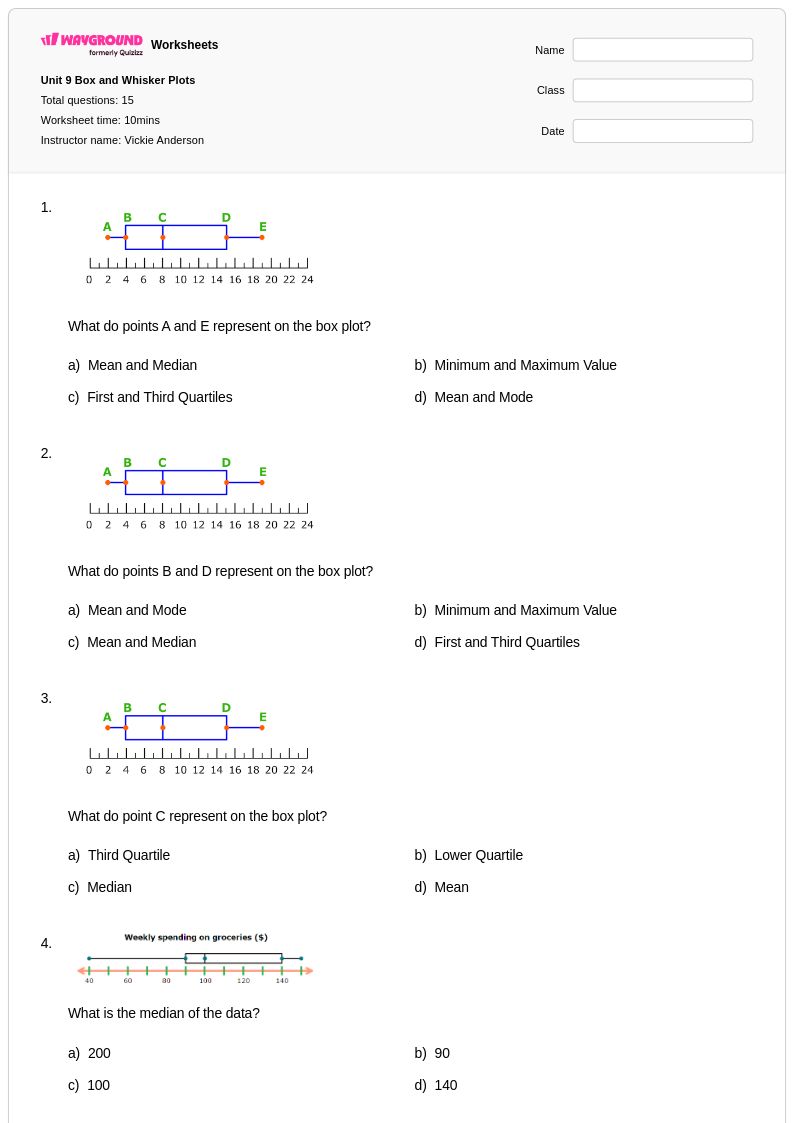
15 Q
9th - 12th
14 Q
8th - 12th
9 Q
8th - 11th
15 Q
7th - 12th
12 Q
9th - 12th

35 Q
9th - 12th
26 Q
8th - 10th
16 Q
9th - 12th
20 Q
6th - Uni
Explore Box and Whisker Plot Worksheets by Grades
Explore Other Subject Worksheets for grade 10
Explore printable Box and Whisker Plot worksheets for Grade 10
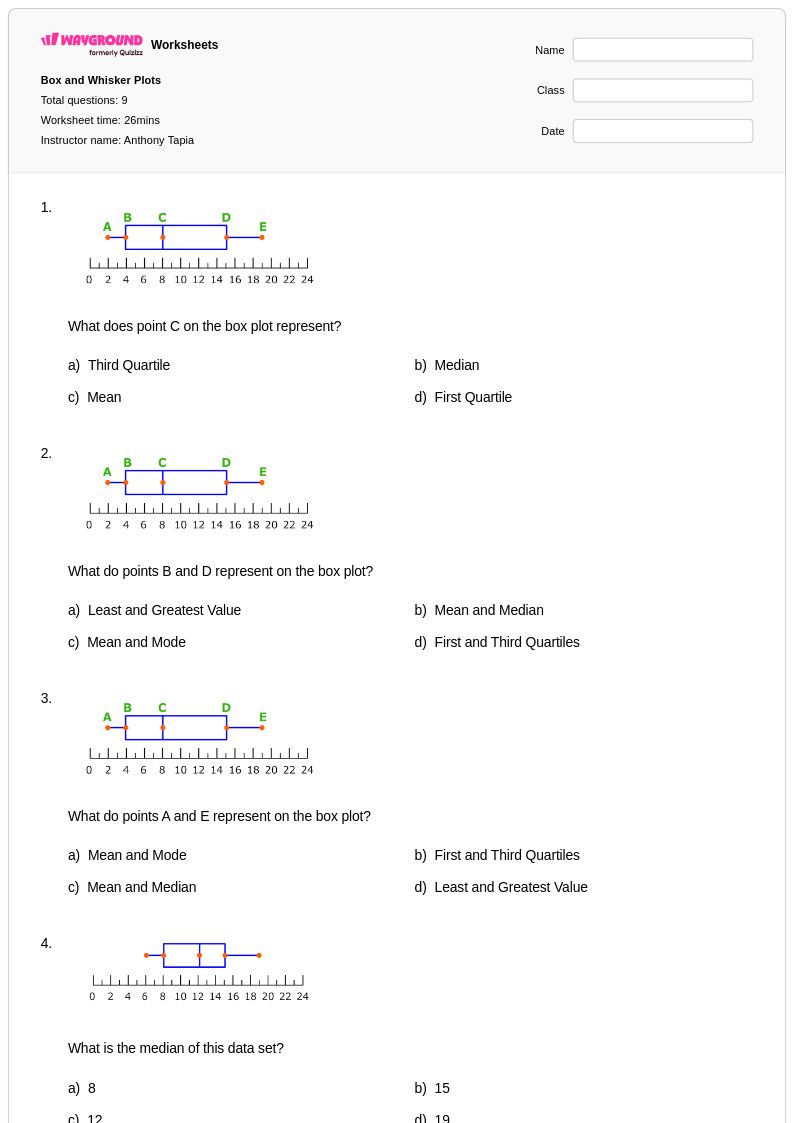
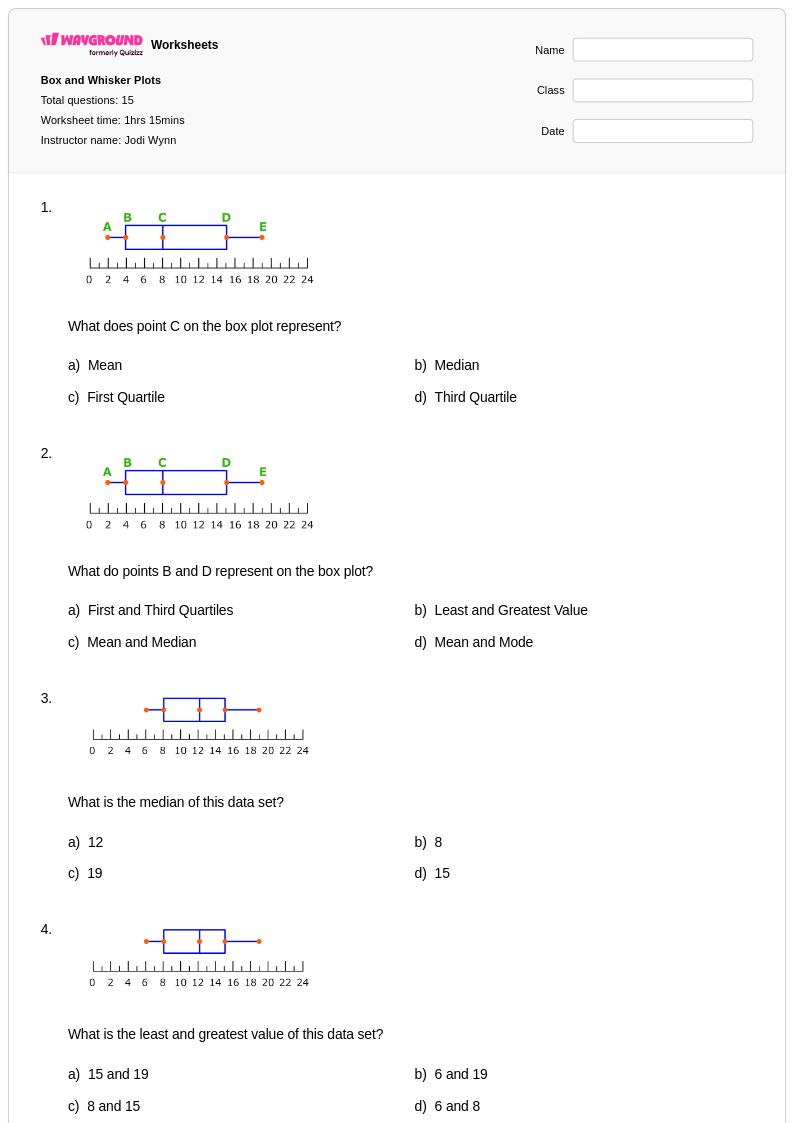
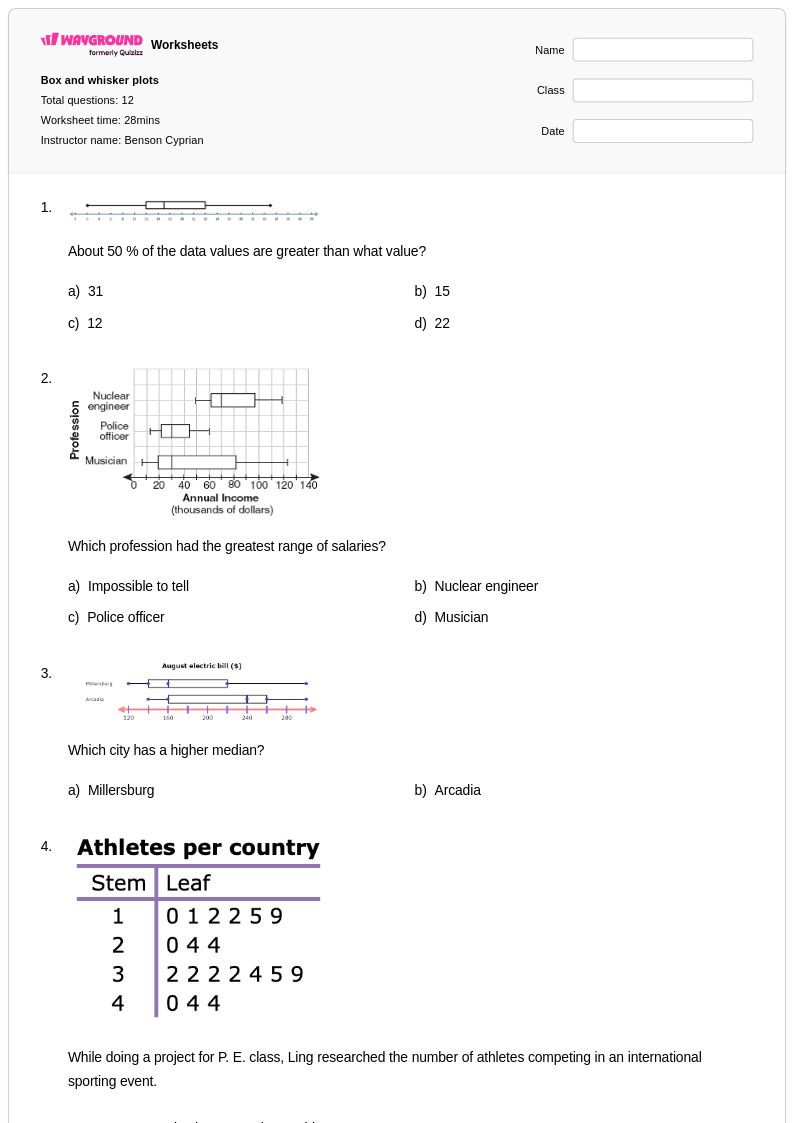
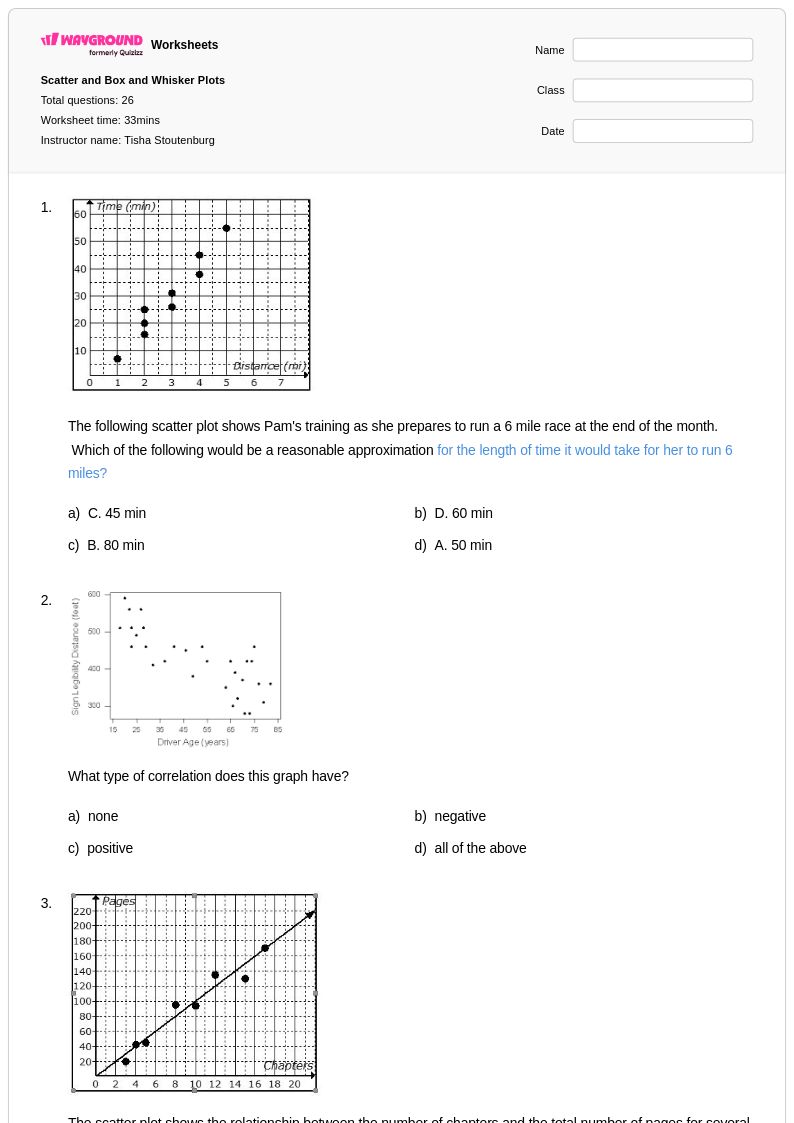
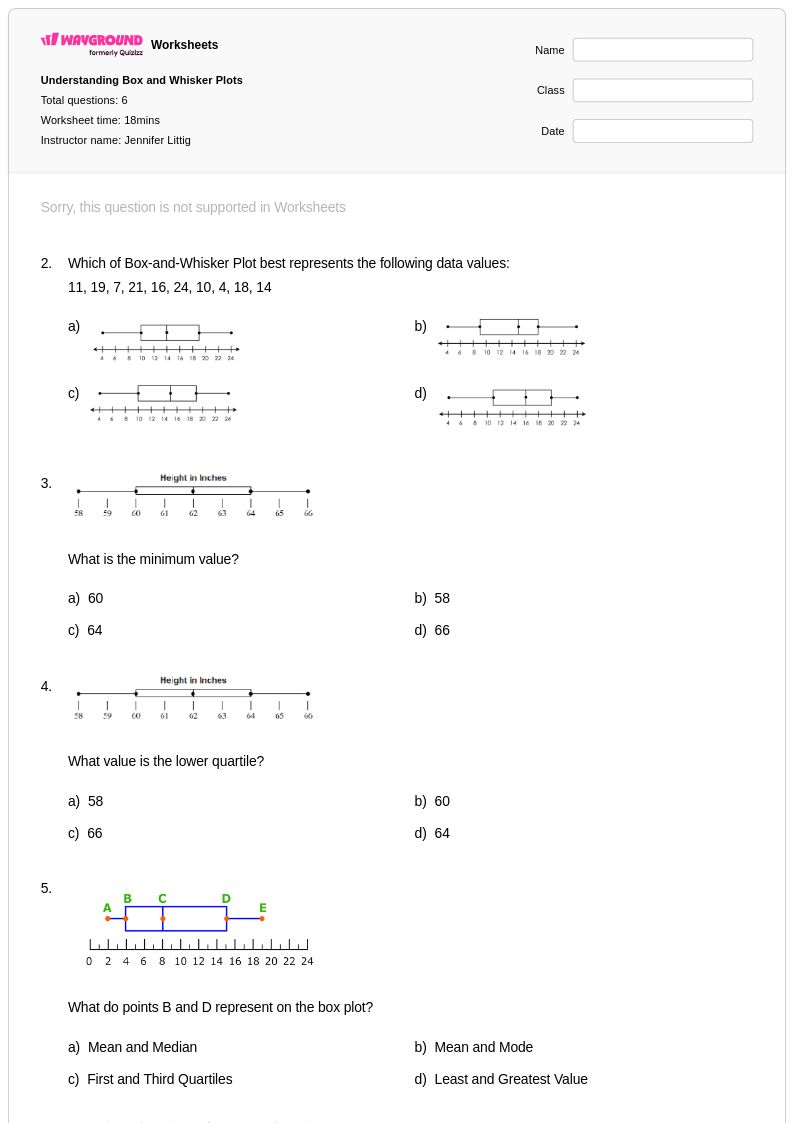
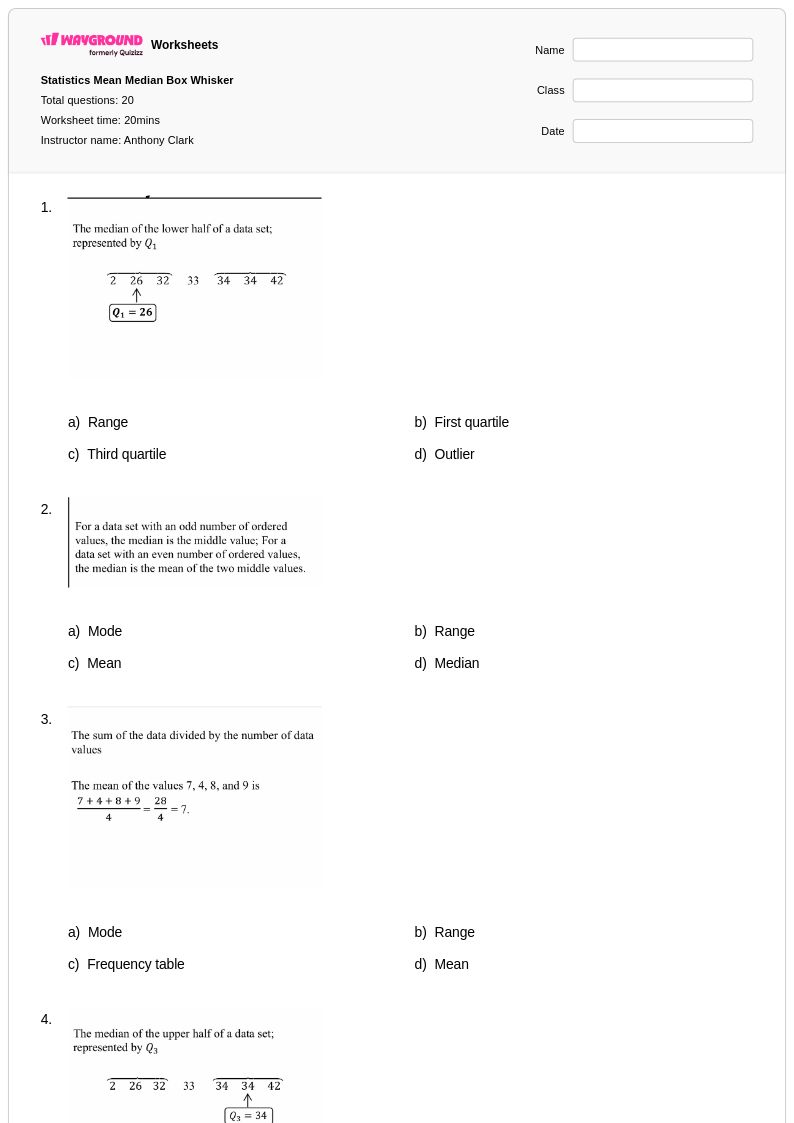
Box and whisker plots serve as essential visual tools in Grade 10 probability and statistics, helping students analyze data distribution through quartiles, medians, and outliers. Wayground's comprehensive collection of box and whisker plot worksheets provides students with structured practice in constructing these statistical diagrams from raw datasets, interpreting the five-number summary, and comparing multiple data sets through side-by-side plots. These free printable resources strengthen critical analytical skills including identifying skewness, understanding variability, and recognizing the relationship between box plots and measures of central tendency. Each worksheet includes detailed answer keys and practice problems that guide students through step-by-step construction methods, from ordering data and calculating quartiles to drawing accurate scaled representations that reflect true data characteristics.
Wayground's millions of teacher-created box and whisker plot resources support educators with extensive search and filtering capabilities that align with Grade 10 mathematics standards for probability and statistics instruction. Teachers can easily differentiate instruction by selecting worksheets that progress from basic five-number summary calculations to advanced comparative analysis activities, with flexible customization options allowing educators to modify problems for remediation or enrichment based on individual student needs. The platform's dual availability in both printable pdf formats and interactive digital versions enables seamless integration into diverse classroom environments, whether supporting traditional paper-based practice sessions or technology-enhanced learning experiences. These comprehensive tools facilitate targeted skill practice and help teachers efficiently plan lessons that build students' confidence in statistical reasoning and graphical data interpretation.