Free Printable Production Possibilities Curve worksheets
Explore Wayground's free Production Possibilities Curve worksheets and printables with answer keys, helping students master economic trade-offs, opportunity costs, and resource allocation through engaging practice problems and PDF activities.
Explore printable Production Possibilities Curve worksheets
Production Possibilities Curve worksheets available through Wayground (formerly Quizizz) provide students with essential practice in understanding one of economics' fundamental analytical tools. These comprehensive resources help students master the concepts of scarcity, opportunity cost, and efficient resource allocation by working through scenarios that demonstrate how societies must choose between competing wants and limited resources. The worksheets strengthen critical thinking skills as students analyze trade-offs, calculate opportunity costs, and interpret graphical representations of economic choices. Each resource includes detailed answer keys that allow for self-assessment and targeted review, while the free printable format ensures accessibility for all learners. Practice problems range from basic curve interpretation to complex scenarios involving economic growth, technological advancement, and resource reallocation.
Wayground (formerly Quizizz) supports educators with an extensive collection of teacher-created Production Possibilities Curve resources drawn from millions of available materials across the platform. The robust search and filtering capabilities enable teachers to quickly locate worksheets that align with specific learning objectives and curriculum standards, while differentiation tools help adapt content for varying student ability levels. Teachers can customize these resources to match their classroom needs, whether delivering content in traditional printable pdf format or through interactive digital assignments. These flexible options facilitate effective lesson planning and provide targeted support for remediation and enrichment activities, ensuring that all students can access meaningful practice opportunities that reinforce their understanding of economic decision-making and resource allocation principles.
FAQs
How do I teach the Production Possibilities Curve to economics students?
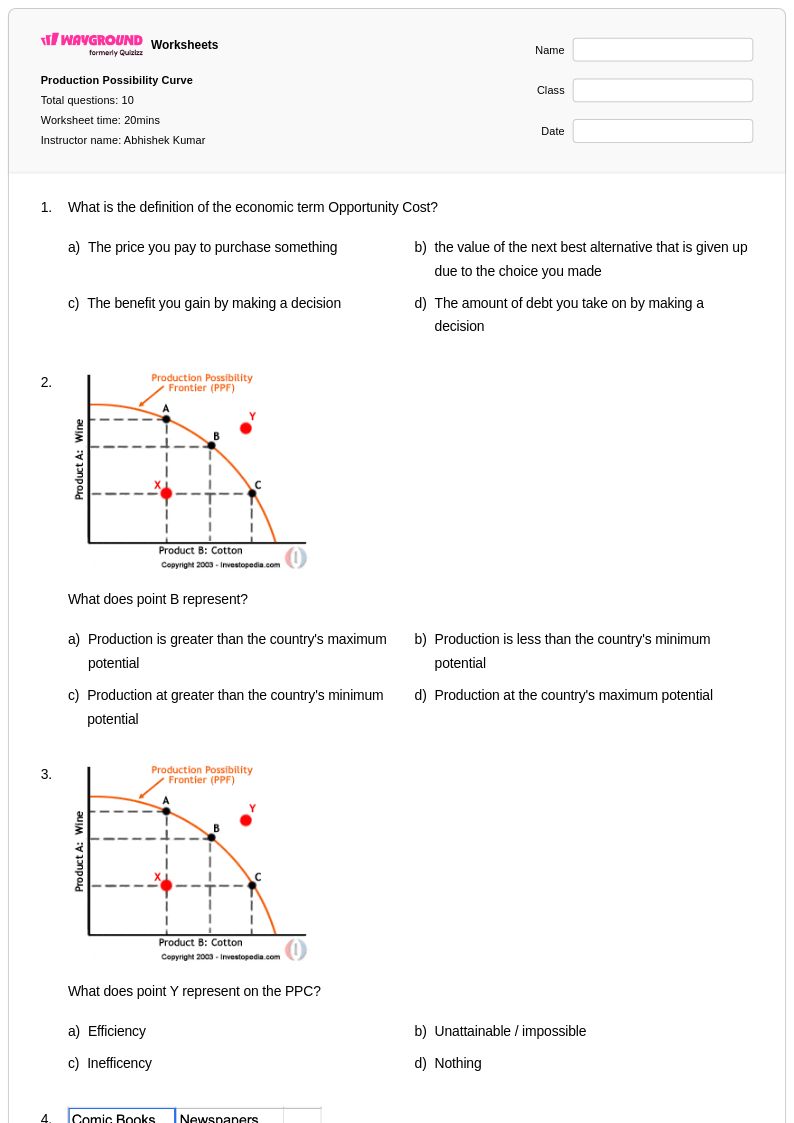
Start by grounding students in the concepts of scarcity and opportunity cost before introducing the curve itself, since the PPC is a graphical representation of those underlying ideas. Use concrete examples — such as a country choosing between producing guns versus butter, or a student allocating time between studying and working — to make the trade-offs tangible. From there, students can move to interpreting shifts in the curve caused by technological advancement or changes in resource availability. Building from concept to graph to scenario analysis tends to produce stronger retention than starting with the graph alone.
What exercises help students practice reading and interpreting a Production Possibilities Curve?
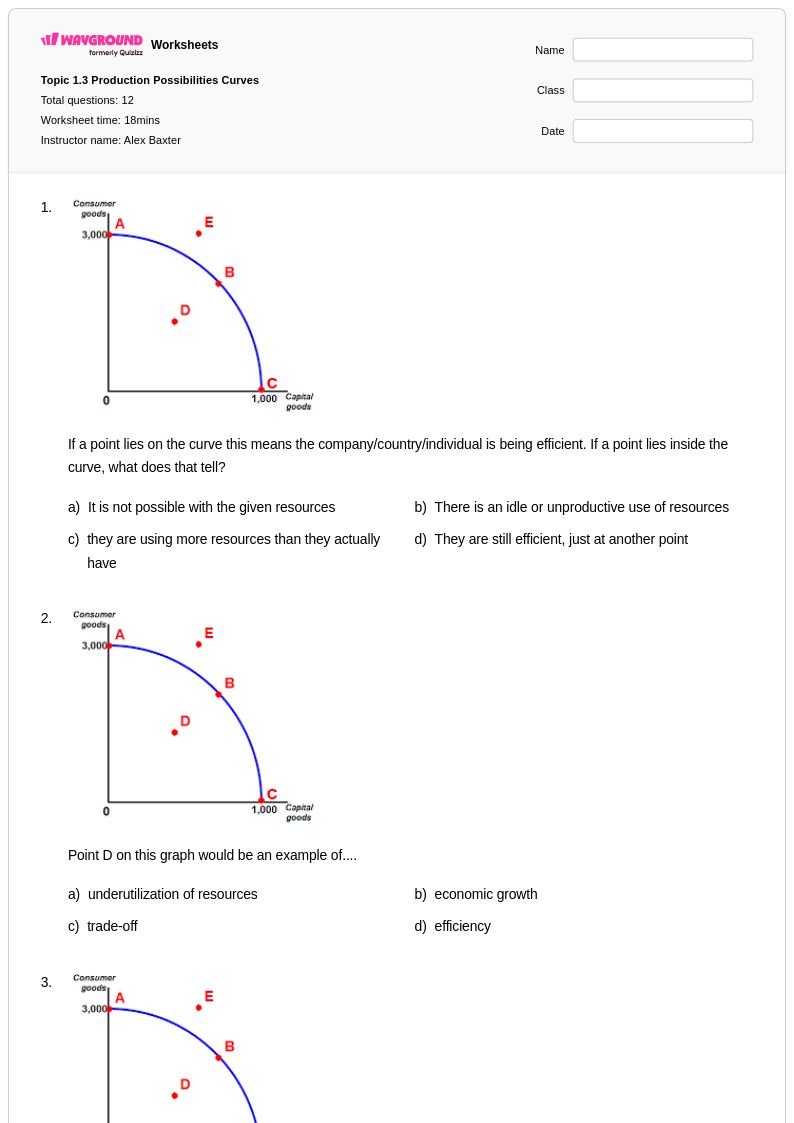
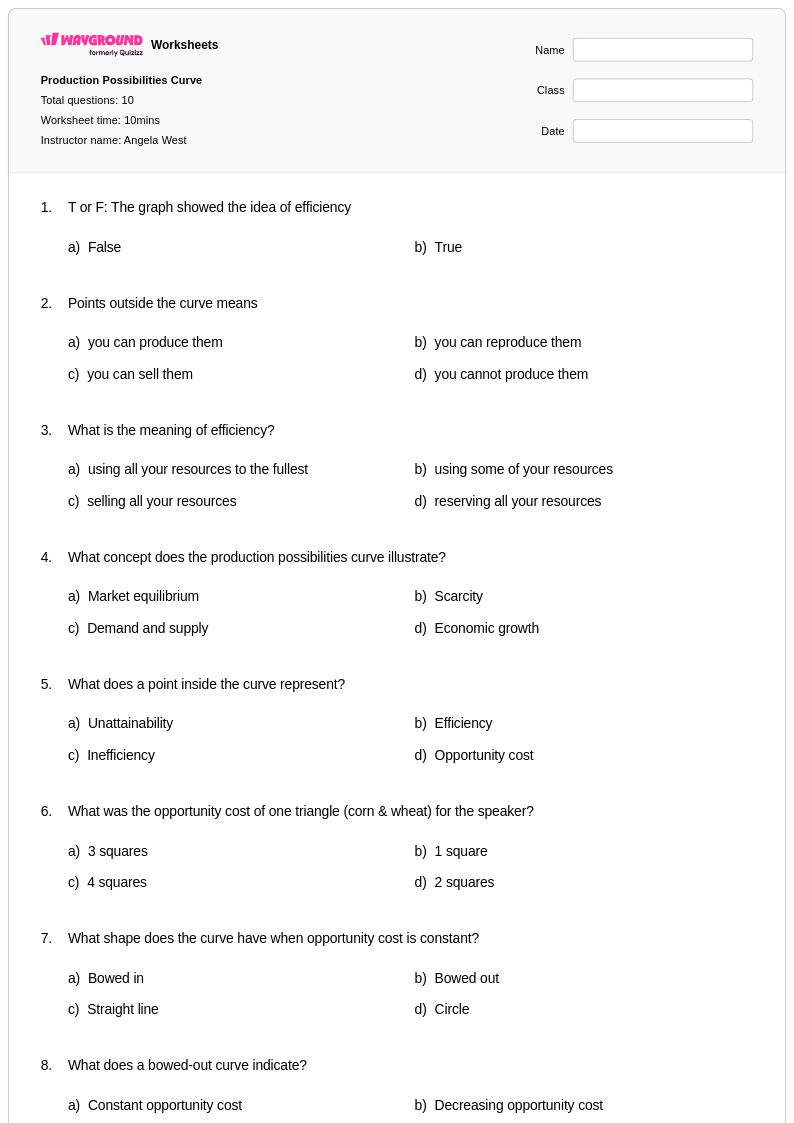
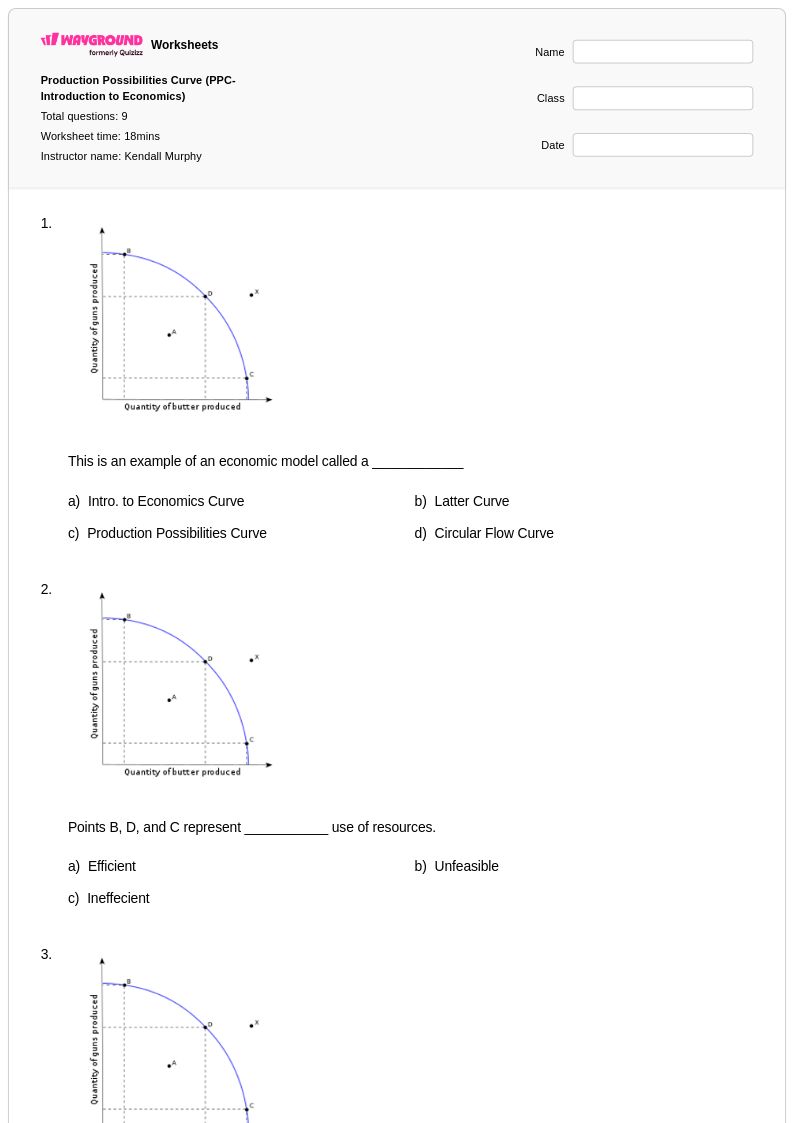
Effective practice includes having students identify points on the curve as efficient, inefficient, or unattainable, and then explain what each position means in terms of resource use. Calculating opportunity costs between two points on the curve reinforces the quantitative side of the concept. Scenario-based problems — such as what happens to the curve when a new technology is introduced or when resources are destroyed — push students to apply their understanding rather than just recall definitions. Worksheets that progress from basic curve interpretation to multi-step scenarios are especially useful for building fluency.
What mistakes do students commonly make when working with the Production Possibilities Curve?
A frequent error is confusing points inside the curve (inefficient) with points outside it (unattainable) — students often mix up the economic meaning of each. Many students also struggle to calculate opportunity cost correctly, particularly when the curve is bowed outward rather than linear, because the trade-off ratio changes at different points along the curve. Another common misconception is assuming that a shift in the PPC always represents economic growth, without recognizing that a curve can shift inward due to resource depletion or disaster. Targeted practice problems that isolate each of these error types help students identify and correct their own misunderstandings.
How do I use Production Possibilities Curve worksheets effectively in my classroom?
These worksheets are available as printable PDFs for traditional classroom use and in digital formats for technology-integrated learning environments, and can also be hosted as a quiz on Wayground for interactive practice. In a print setting, they work well as guided practice during instruction or as independent review. In digital mode, teachers can assign them as homework, use them for formative assessment, or project them for whole-class discussion. Because the worksheets include answer keys, students can self-assess after completing problems, which supports independent review and targeted remediation.
How can I differentiate Production Possibilities Curve instruction for students at different ability levels?
For students who need additional support, reduce cognitive load by starting with linear PPCs before introducing bowed curves, and provide partially completed graphs for students to finish rather than drawing from scratch. On Wayground, teachers can apply accommodations such as reduced answer choices and read-aloud features to individual students without alerting the rest of the class, making differentiation seamless. For advanced students, extend practice with scenarios involving comparative advantage or multi-good economies that require deeper analytical reasoning.
How do I explain opportunity cost using the Production Possibilities Curve?
The PPC makes opportunity cost visible by showing exactly how much of one good must be sacrificed to produce more of another. When the curve is linear, the opportunity cost is constant at every point along it; when the curve is bowed outward, the opportunity cost increases as production shifts more heavily toward one good, reflecting the law of increasing opportunity cost. Teachers should prompt students to read specific coordinate pairs on the curve and calculate the trade-off explicitly, rather than describing it in abstract terms. This quantitative approach clarifies the concept more effectively than a definition alone.