Font size
 Worksheets
weather sysmbols
Total questions: 82
Worksheet time: 1hrs 25mins

cold front
warm front
high pressure
low pressure

cold front
warm front
high pressure
low pressure

cold front
warm front
high pressure
low pressure
cold air moving into an area
warm air moving into an area
humid air over an area
dry air over an area

cold air moving into an area
warm air moving into an area
humid air over an area
dry air over an area

cold air moving into an area
warm air moving into an area
humid air over an area
dry air over an area

cold air moving into an area
warm air moving into an area
humid air over an area
dry air over an area

decreasing temperatures
increasing temperatures
cloudy sky, maybe precipitation
clear sky, sunny weather

decreasing temperatures
increasing temperatures
cloudy sky, maybe precipitation
clear sky, sunny weather

decreasing temperatures
increasing temperatures
cloudy sky, maybe precipitation
clear sky, sunny weather

decreasing temperatures
increasing temperatures
cloudy sky, maybe precipitation
clear sky, sunny weather

Cold air is approaching Location A
Warm air is approaching Location A
Cold air is approaching Location B
Warm air is approaching Location B

Cold air is approaching Location A
Warm air is approaching Location A
Cold air is approaching Location B
Warm air is approaching Location B

Cold air is approaching Location A
Warm air is approaching Location A
Cold air is approaching Location B
Warm air is approaching Location B

It's warmer at location A
It's warmer at location B

It's cooler at location A
It's cooler at location B

Location A would produce the strongest cyclones
Location B would produce the strongest cyclones
Location C would produce the strongest cyclones
Location D would produce the strongest cyclones
The WEAKEST cyclones would be found at location Location A
The WEAKEST cyclones would be found at location Location B
The WEAKEST cyclones would be found at location Location C
The WEAKEST cyclones would be found at location Location D


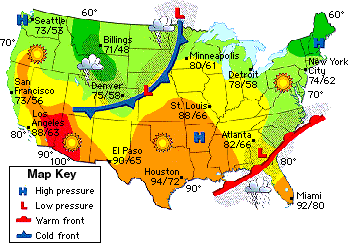
What city will experience decreasing temperatures in the next day?
Denver
El Paso
Memphis
Los Angeles

What does this symbol represent?
Cold Front
Warm Front
Stationary Front
Occluded Front

What does this symbol represent?
Cold Front
Warm Front
Stationary Front
Occluded Front

What does this symbol represent?
Cold Front
Warm Front
Stationary Front
Occluded Front

What does this symbol represent?
Cold Front
Warm Front
Stationary Front
Occluded Front
Warm Fronts bring
rain followed by cool dry air
hurricanes
rain followed by hot humid air
fair weather

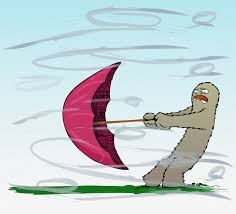

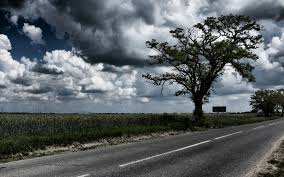


What will south Georgia's temperature be like tomorrow?
upper 80's
lower 70's
mid 50's
upper 60's
What are clouds made from?
dust
water droplets
air
cotton

What`s the weather like?
sunny
foggy
rainy
hot

What`s the weather like?
warm
hot
sunny
foggy

What`s the weather like?
cloudy
warm
hot
rainy

What`s the weather like?
cold
foggy
windy
sunny

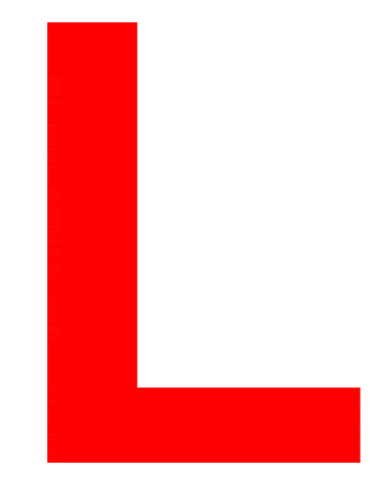
What type of pressure system is represented in the picture?
low pressure
high pressure

What type of pressure system is represented in the picture?
low pressure
high pressure

name this front
warm front
cold front
stationary front
occluded front

name this front
warm front
cold front
stationary front
occluded front

What is this weather symbol?
Sunny
Rainy
Partly Cloudy
Stormy

What does this weather symbol mean?
Rain
Thunderstorm
Partly Cloudy
Sunny

What is this weather symbol mean?
Snow
Rain
Sunny
Partly Cloudy

Based on the weather map, which city will most likely experience increasing temperatures during the next 24 hours?
Denver, because it is raining there
Minneapolis, because a cold front is approaching
Atlanta, because a warm front is approaching
Houston, because it is in a high pressure area