wayground logo

Free Printable Worksheets

Font size

S
M
L
XL
Worksheets

Unit 4 Populations

Total questions: 154

Worksheet time: 2hrs 57mins
Name
Class
Date
1.
1. An island off the coast of Africa contains a larger percentage of specialist species than generalist species. Which of the following describes the most immediate effect if an invasive generalist species is introduced to the island?
a)
(A) As predation increases, the population size of the invasive generalist species will decrease.
b)
(B) As competition for resources increases, the population size of the island’s specialist species will decrease.
c)
(C) As resources are partitioned, the population sizes of both the generalist species and the specialist species will increase.
2.
3. The phrase that best defines population density is
a)
(A) the number of individuals in a certain geographic area
b)
(B) the rate at which a population increases
c)
(C) the maximum number of individuals that a habitat can sustain
d)
(D) the time it takes for a population to increase to carrying capacity
3.
4. Which is the highest population density of grasshoppers?
a)
A. 45 grasshoppers/10 square meters
b)
B. 40 grasshoppers/20 square meters
c)
C. 1 grasshopper/1 square meter
d)
D. 50 grasshoppers/30 square meters
4.
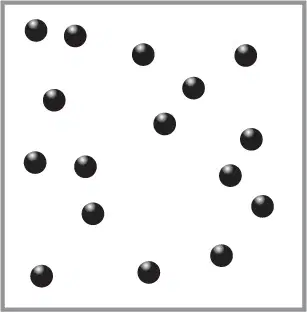
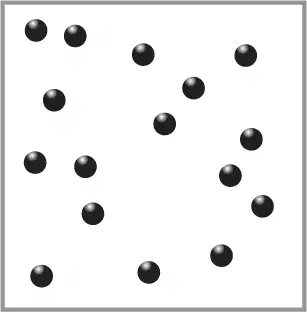
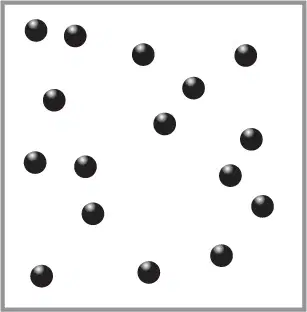
5. The diagram shows a ______________ distribution pattern.
a)
Clumped
b)
Random
c)
Even
5.
10. In a nutshell,_____________ populations are more "YOLO" type while _____________ populations are more "dig in and play for the future" type. Check all that Apply.
a)
R-selected, K-selected
b)
K-selected, R-selected
6.
11. A model of population growth is shown below. Which letter indicates when the population is growing at its fastest rate?
a)
A
b)
B
c)
C
d)
D
7.
12. A model of population growth is shown below. At which point is resource use exceeding resource availability?
a)
A
b)
B
c)
C
d)
D
8.
13. A model of population growth is shown below. At which point is overshoot?
a)
A
b)
B
c)
C
d)
D
9.
14. A model of population growth is shown below. At which point is dieoff/dieback?
a)
A
b)
B
c)
C
d)
D
10.
15. A model of population growth is shown below. What does line K Represent?
a)
Overshoot
b)
Dieoff
c)
Carrying Capacity
11.
16. Which factor is unrelated to the dashed line, K, which indicates the carrying capacity?
a)
Diseases increase.
b)
Predation increases.
c)
Biological wastes accumulate.
d)
Forest fires result in habitat destruction.
12.
17. "K" and "r" are used to describe which of the following aspects of populations?
a)
(A) The place in a habitat where these organisms live
b)
(B) The number of males and females in the population
c)
(C) The reproductive tactics used by the populations
d)
(D) The time it takes a population to double
13.
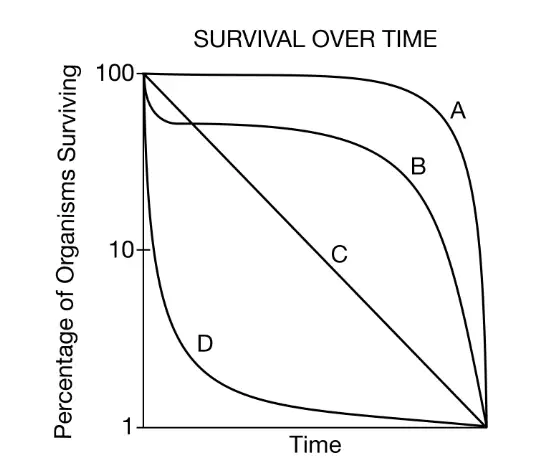
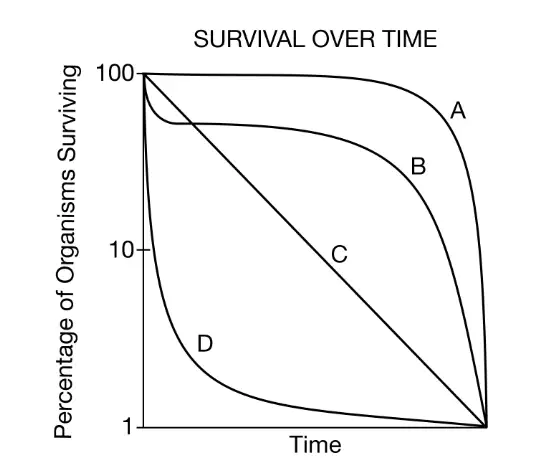
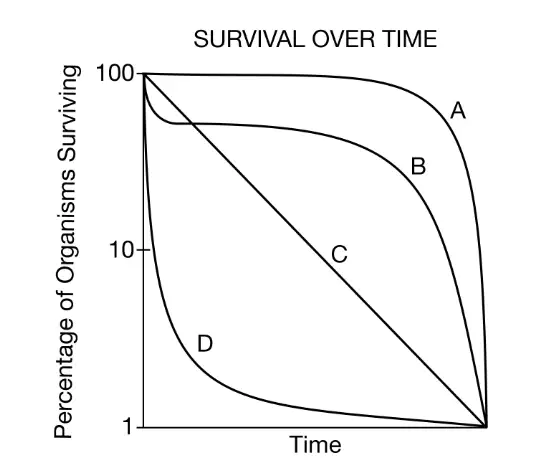
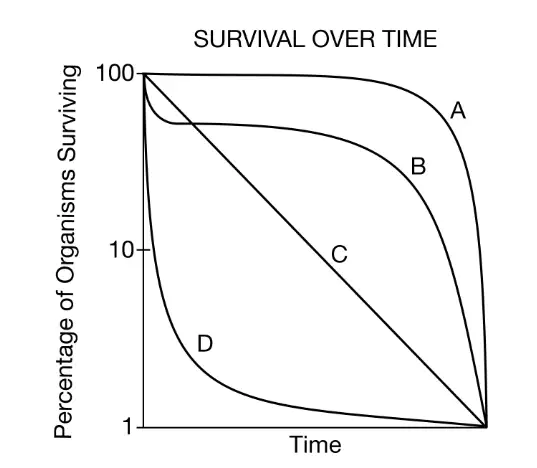
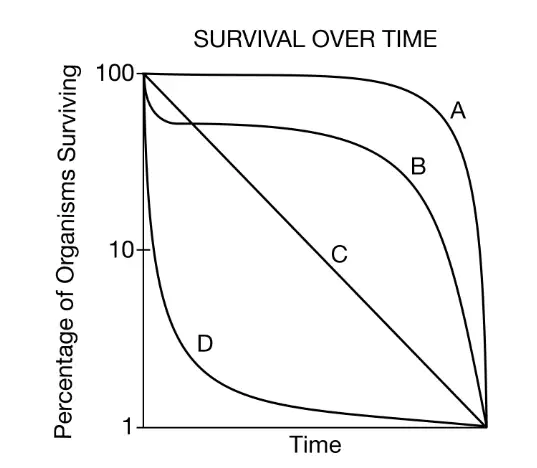
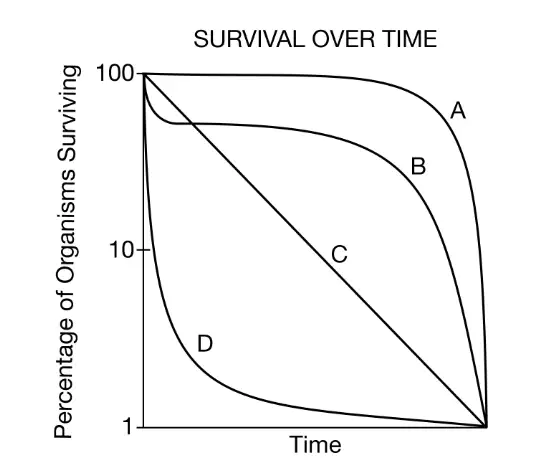
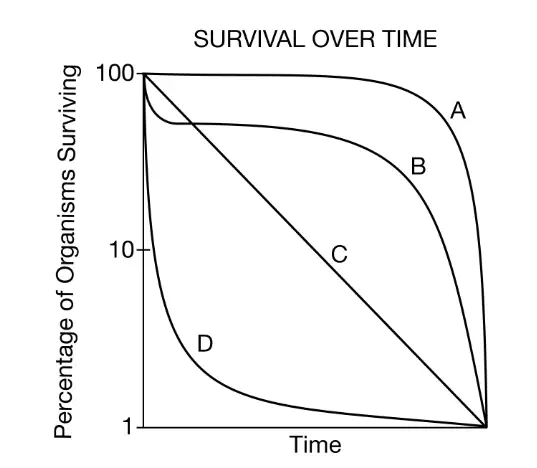
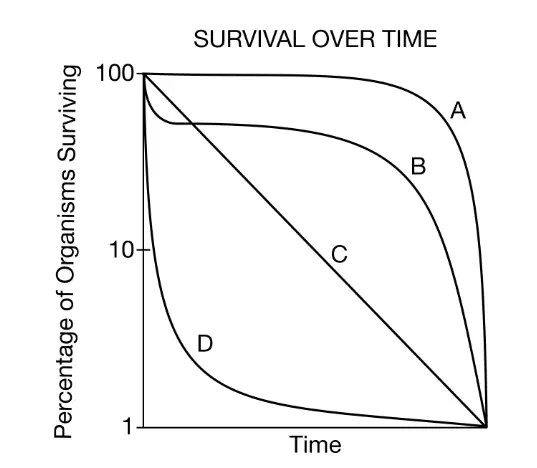
18. Dandelions grow quickly and produce many seeds, ensuring that at least some plants will survive and produce seeds themselves. Which curve best represents the survivorship of dandelions?
a)
A
b)
B
c)
C
d)
D
14.
19. Bowhead whales can live 200 years , fin whales live close to 100 years, and most toothed whales live for 20 to 60 years. Which curve best represents the survivorship of whales?
a)
A
b)
B
c)
C
d)
D
15.
20. Lines and A and B represent what type of survivorship?
a)
Type I Survivorship
b)
Type II Survivorship
c)
Type III Survivorship
d)
none of these
16.
21. Line D represents what type of survivorship?
a)
Type I Survivorship
b)
Type II Survivorship
c)
Type III Survivorship
d)
none of these
17.
22. Line D would mostly likely follow what type of reproductive strategy?
a)
K- Selection
b)
R- Selection
c)
none of these
18.
23. Line A and B would mostly likely follow what type of reproductive strategy?
a)
K- Selection
b)
R- Selection
c)
none of these
19.
24. Line C represents what type of survivorship?
a)
Type I Survivorship
b)
Type II Survivorship
c)
Type III Survivorship
d)
none of these
20.
25. Which pattern describes a type I survivorship curve?
a)
Low survivorship early in life with few individuals reaching adulthood
b)
Low survivorship early in life with many individuals reaching adulthood
c)
Constant decline in survivorship throughout most of the lifespan
d)
High survival throughout the lifespan until individuals die in old age
21.
1. Of these factors which most likely contributed to the exponential growth of the human population?
a)
more food, better hygiene
b)
increased immigration
c)
less food, better healthcare
d)
higher birth rates
22.
2. Which of the following most likely makes it difficult to reduce population growth?
a)
High literacy rates results in woment wanting to have more children
b)
Population sizes will not decline until some people start having to do without food an other necessities of life
c)
Many people live in cities, where large families are an advantage
d)
Many people have low literacy and limited access to health care.
23.
3. The phrase that best defines population density is
a)
(A) the number of individuals in a certain geographic area
b)
(B) the rate at which a population increases
c)
(C) the maximum number of individuals that a habitat can sustain
d)
(D) the time it takes for a population to increase to carrying capacity
24.
4. Which is the highest population density of grasshoppers?
a)
A. 35 grasshoppers/10 square meters
b)
B. 40 grasshoppers/20 square meters
c)
C. 1 grasshopper/1 square meter
d)
D. 50 grasshoppers/30 square meters
25.
5. The diagram shows a ______________ distribution pattern.
a)
Clumped
b)
Random
c)
Even
26.
9. In a nutshell,_____________ populations are more "YOLO" type while _____________ populations are more "dig in and play for the future" type. Check all that Apply.
a)
R-selected, K-selected
b)
K-selected, R-selected
c)
Exponential, Logistic
d)
Logistic, Exponential
27.
11. The population of a country is 20 million people in 2020. The growth rate of the country is 2.4%. Assuming that the growth rate remains constant, in which year will the population of the country be 40 million people?
a)
a. 2039
b)
b. 2049
c)
c. 2079
d)
d. 2099
28.
14. A model of population growth is shown below. Which letter indicates when the population is growing at its fastest rate?
a)
A
b)
B
c)
C
d)
D
29.
15. A model of population growth is shown below. At which point is resource use exceeding resource availability?
a)
A
b)
B
c)
C
d)
D
30.
16. A model of population growth is shown below. At which point is overshoot?
a)
A
b)
B
c)
C
d)
D
31.
27. A model of population growth is shown below. At which point is dieoff/dieback?
a)
A
b)
B
c)
C
d)
D
32.
18. A model of population growth is shown below. What does line K Represent?
a)
Overshoot
b)
Dieoff
c)
Carrying Capacity
33.
19. Which factor is unrelated to the dashed line, K, which indicates the carrying capacity?
a)
Diseases increase.
b)
Predation increases.
c)
Biological wastes accumulate.
d)
Forest fires result in habitat destruction.
34.
20. Which of the following would be most likely to increase competition among the members of a squirrel population in a given area?
a)
(A) An epidemic of rabies within the squirrel population
b)
(B) An increase in the number of hawk predators
c)
(C) An increase in the reproduction of squirrels
d)
(D) An increase in temperature
35.
21. Examine the following graph, which shows the predator-prey relationship between hares and lynxes. The population cycles of the snowshoe hare and its predator, the lynx, reveal that
a)
(A) the prey population is controlled by predators alone
b)
(B) hares and lynxes are so mutually dependent that each species cannot survive without the other
c)
(C) the relationship is primarily independent; in other words, the number of hares does not have any effect on the number of lynxes and vice versa
d)
(D) both hare and lynx populations are regulated mainly by abiotic factors
36.
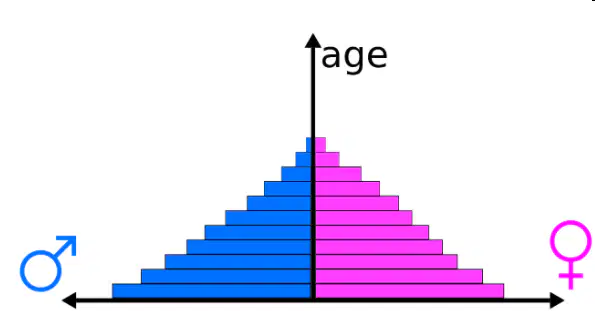
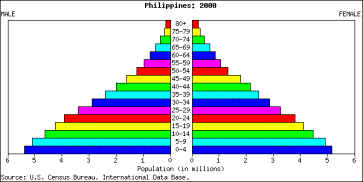
22.Examine the age structure diagram here. The nation whose population is represented by the pyramid is likely
a)
growing in population size.
b)
demonstrating a high rate of disease among 25-35-year olds
c)
affording more educational opportunities for women than men.
d)
experiencing a baby boom that is entering the workforce.
37.
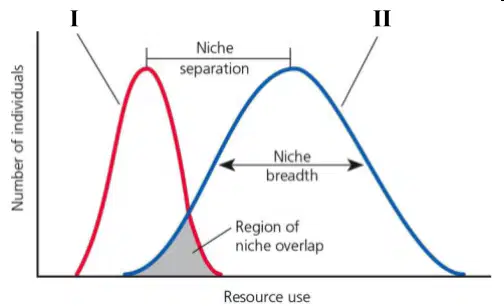
25. A graph of the resource utilization for two species, I and II, is shown here. Which description best fits the pattern of resource utilization indicated in the graphs?
a)
Species I is a specialist and species II is a generalist.
b)
Species I is r-selected and species II is K-selected.
c)
Species I is more recently evolved that species II.
d)
Species I is undergoing exponential growth and species II is undergoing logistic growth.
38.
26. Which species likely produces the fewest number of offspring per generation?
a)
A
b)
B
c)
C
d)
D
39.
27. "K" and "r" are used to describe which of the following aspects of populations?
a)
(A) The place in a habitat where these organisms live
b)
(B) The number of males and females in the population
c)
(C) The reproductive tactics used by the populations
d)
(D) The time it takes a population to double
40.
35. Based on the information in the diagram above, which of the following was likely true about the US population in 2014?
a)
(A) The total fertility rate was between 1 and 2.
b)
(B) The total fertility rate was between 2 and 3.
c)
(C) The total fertility rate was between 3 and 4.
d)
(D) The total fertility rate was between 4 and 5.
41.
36. The world's population in 2010 was approximately 7 billion. If the population growth rate was 2%, in what year would the world's population have doubled to 14 billion?
a)
(A) 2045
b)
(B) 2090
c)
(C) 2100
d)
(D) 2110
42.
1. An island off the coast of Africa contains a larger percentage of specialist species than generalist species. Which of the following describes the most immediate effect if an invasive generalist species is introduced to the island?
a)
(A) As predation increases, the population size of the invasive generalist species will decrease.
b)
(B) As competition for resources increases, the population size of the island’s specialist species will decrease.
c)
(C) As resources are partitioned, the population sizes of both the generalist species and the specialist species will increase.
43.
3. The phrase that best defines population density is
a)
(A) the number of individuals in a certain geographic area
b)
(B) the rate at which a population increases
c)
(C) the maximum number of individuals that a habitat can sustain
d)
(D) the time it takes for a population to increase to carrying capacity
44.
4. Which is the highest population density of grasshoppers?
a)
A. 45 grasshoppers/10 square meters
b)
B. 40 grasshoppers/20 square meters
c)
C. 1 grasshopper/1 square meter
d)
D. 50 grasshoppers/30 square meters
45.
5. The diagram shows a ______________ distribution pattern.
a)
Clumped
b)
Random
c)
Even
46.
10. In a nutshell,_____________ populations are more "YOLO" type while _____________ populations are more "dig in and play for the future" type. Check all that Apply.
a)
R-selected, K-selected
b)
K-selected, R-selected
47.
11. A model of population growth is shown below. Which letter indicates when the population is growing at its fastest rate?
a)
A
b)
B
c)
C
d)
D
48.
12. A model of population growth is shown below. At which point is resource use exceeding resource availability?
a)
A
b)
B
c)
C
d)
D
49.
13. A model of population growth is shown below. At which point is overshoot?
a)
A
b)
B
c)
C
d)
D
50.
14. A model of population growth is shown below. At which point is dieoff/dieback?
a)
A
b)
B
c)
C
d)
D
51.
15. A model of population growth is shown below. What does line K Represent?
a)
Overshoot
b)
Dieoff
c)
Carrying Capacity
52.
16. Which factor is unrelated to the dashed line, K, which indicates the carrying capacity?
a)
Diseases increase.
b)
Predation increases.
c)
Biological wastes accumulate.
d)
Forest fires result in habitat destruction.
53.
17. "K" and "r" are used to describe which of the following aspects of populations?
a)
(A) The place in a habitat where these organisms live
b)
(B) The number of males and females in the population
c)
(C) The reproductive tactics used by the populations
d)
(D) The time it takes a population to double
54.
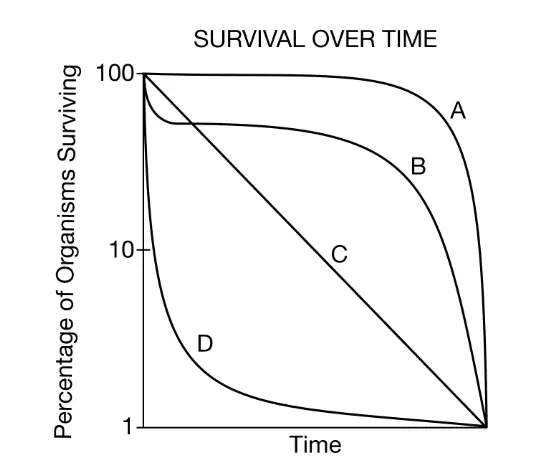
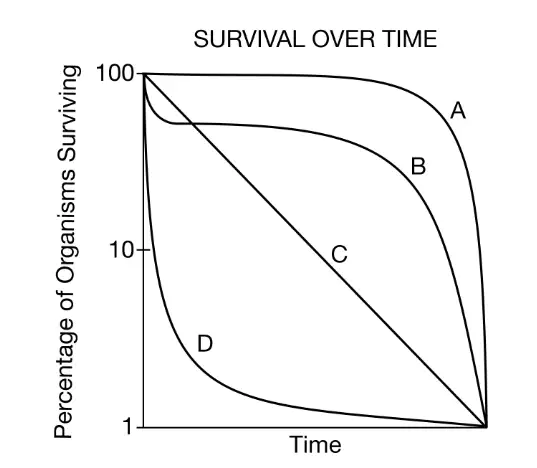
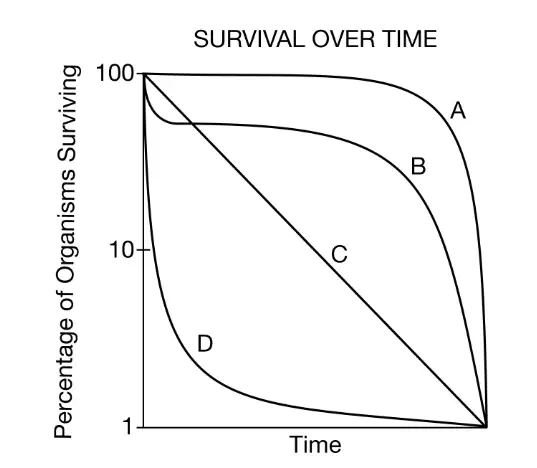
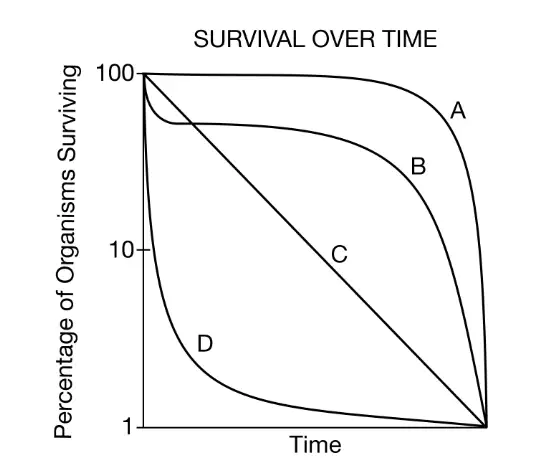
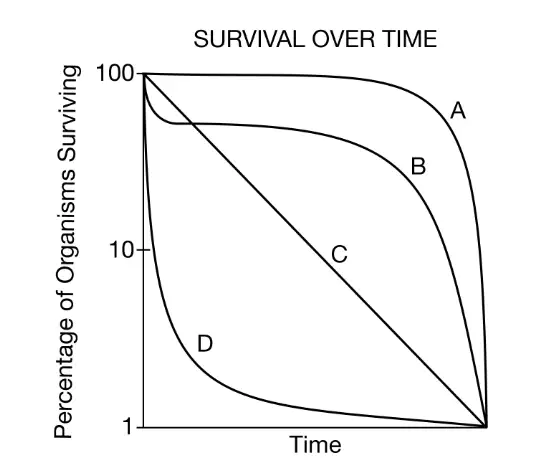
18. Dandelions grow quickly and produce many seeds, ensuring that at least some plants will survive and produce seeds themselves. Which curve best represents the survivorship of dandelions?
a)
A
b)
B
c)
C
d)
D
55.
19. Bowhead whales can live 200 years , fin whales live close to 100 years, and most toothed whales live for 20 to 60 years. Which curve best represents the survivorship of whales?
a)
A
b)
B
c)
C
d)
D
56.
20. Lines and A and B represent what type of survivorship?
a)
Type I Survivorship
b)
Type II Survivorship
c)
Type III Survivorship
d)
none of these
57.
21. Line D represents what type of survivorship?
a)
Type I Survivorship
b)
Type II Survivorship
c)
Type III Survivorship
d)
none of these
58.
22. Line D would mostly likely follow what type of reproductive strategy?
a)
K- Selection
b)
R- Selection
c)
none of these
59.
23. Line A and B would mostly likely follow what type of reproductive strategy?
a)
K- Selection
b)
R- Selection
c)
none of these
60.
24. Line C represents what type of survivorship?
a)
Type I Survivorship
b)
Type II Survivorship
c)
Type III Survivorship
d)
none of these
61.
25. Which pattern describes a type I survivorship curve?
a)
Low survivorship early in life with few individuals reaching adulthood
b)
Low survivorship early in life with many individuals reaching adulthood
c)
Constant decline in survivorship throughout most of the lifespan
d)
High survival throughout the lifespan until individuals die in old age
62.
Name that population pyramid...
a)
Exponential
b)
Declining
c)
Rapid Growth
d)
Stable Growth
63.
Name that population pyramid...
a)
Exponential
b)
Declining
c)
Rapid Growth
d)
Stable Growth
64.
Name that population pyramid...
a)
Developed Country
b)
Developing Country
c)
Unindustrialized Country
d)
Country with Poor Medical Care
65.
Name that population pyramid...
a)
Industrialized Country
b)
Country with Clean Water
c)
Developing Country
d)
Logistic Growth
66.
Name that population pyramid?
a)
Stable Growth
b)
Developing Country
c)
Exponential Growth
d)
Negative Growth
67.
Name that population pyramid...
a)
Exponential Growth
b)
Developing Country
c)
Underdeveloped Country
d)
Developed Country
68.
Name that population pyramid...
a)
Country with Good Roads and Bridges
b)
Country with Access to Medical Care
c)
Most People are Educated
d)
Poor Water and Sanitation Systems
69.
Name that population pyramid...
a)
Rapid Growth
b)
Industrialized Country
c)
Declining Growth
d)
Stable Growth
70.
Name that population pyramid...
a)
Declining Growth
b)
Rapid Growth
c)
Stable Growth
71.
Name that population pyramid...
a)
Rapid Growth
b)
Industrialized Country
c)
Declining Growth
d)
Stable Growth
72.
Name that population pyramid...
a)
Developing Country
b)
Developed Country
c)
Industrialized Country
d)
Stable Growth
73.
Name that population pyramid...
a)
Exponential Growth
b)
Developing Country
c)
Stable Growth
d)
Declining Growth
74.
a)
Rapid Growth
b)
Stable Growth
c)
Declining Growth
d)
Logistic Growth
75.
a)
Exponential Growth
b)
Stable Growth
c)
Declining Growth
76.
a)
Exponential Growth
b)
Stable Growth
c)
Declining Growth
77.
a)
Exponential Growth 
b)
Stationary Growth
c)
Declining Growth
78.
Name that population pyramid...
a)
Negative Growth
b)
Stable Growth
c)
Exponential Growth
d)
Logistic Growth
79.

Type 3 graphs show

a)

Some death rates

b)

Death rates through out

c)

Death rates at older ages

d)

High death rates at a young age

80.

Type 1 curve represents what type of group

a)

Birds

b)

Humans

c)

Trees and plants

d)

Marine life

81.

What are survivorship curves?

a)

curves that describe the number of survivors over time

b)

curves that tell us what the limiting factors are

c)

curve that tells us about the carrying capacity

d)

a curve

82.

Type 2 curve shows us

a)

deaths at the end

b)

the graph going down

c)

constant death at all stages

d)

death at the beginning

83.
Name that population pyramid...
a)
Exponential
b)
Declining
c)
Rapid Growth
d)
Stable Growth
84.
Name that population pyramid?
a)
Stable Growth
b)
Developing Country
c)
Exponential Growth
d)
Negative Growth
85.
Name that population pyramid...
a)
Rapid Growth
b)
Industrialized Country
c)
Declining Growth
d)
Stable Growth
86.
a)
Exponential Growth
b)
Stable Growth
c)
Declining Growth
87.
According to the age structure of this country, its population is most likely...
a)
growing slowly.
b)
growing rapidly.
c)
decreasing.
d)
not changing.
88.

A graph that shows the number or proportion of individuals surviving to each age for a given species or group.

a)

survivorship curve

b)

exponential

c)

linear

d)

logistic

89.

Tracks organisms that tend to live long lives (low death rate and high survivorship rate); toward the end of their life expectancies, however, there is a dramatic increase in the death rate.

a)

Type I

b)

Type II

c)

Type III

d)

Type IV

90.

Describes organisms with a high death rate (or low survivorship rate) immediately following birth. Examples include bacteria, fishes, and invertebrates.

a)

Type I

b)

Type II

c)

Type III

d)

Type IV

91.
Which definition best matches the term population density?
a)
human beings in general
b)
number of people in a particular area
c)
A measurement of people for a specific area
d)
All the inhabitants of a particular area
92.
Which definition best matches the term population?
a)
A measurement of people for a specific area
b)
All the inhabitants of a particular area
c)
human beings in general
d)
the increase in the number of people in a particular area
93.
Which is [likely to be] more densely populated?
a)
desert
b)
coast
94.
Which is [likely to be] more densely populated?
a)
temperate climate
b)
polar climate
95.

The average number of people living in an area

a)

population distribution

b)

population density

c)

urbanization

d)

population rate

96.

Which state has the greatest population density?

a)

New Jersey

b)

Rhode Island

c)

Connecticut

d)

Vermont

97.

Which state has the largest population?

a)

New Hampshire

b)

Pennsylvania

c)

New Jersey

d)

New York

98.

How are people spread out on the earth's surface?

a)

evenly

b)

unevenly

99.

What is another name for a city?

a)

rural area

b)

urban area

c)

suburban area

100.
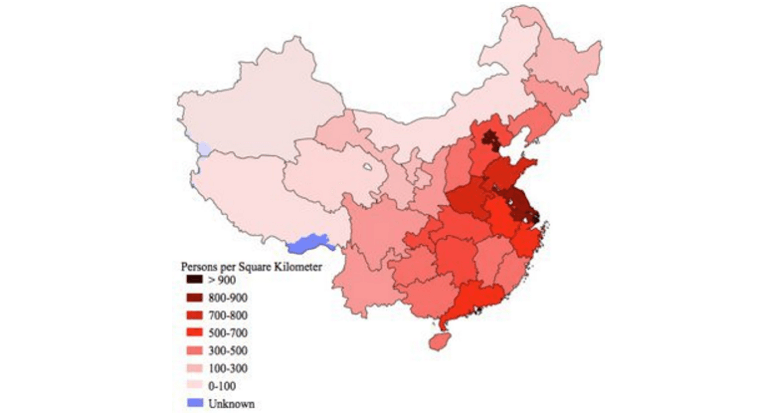
Which of these best explains the high population density in China's eastern region?
a)
The region is not capable of supporting large scale farming
b)
The region is close to the ocean and has favorable climate
c)
The region is home to the emperor 
d)
The region is located near active volcanoes
101.
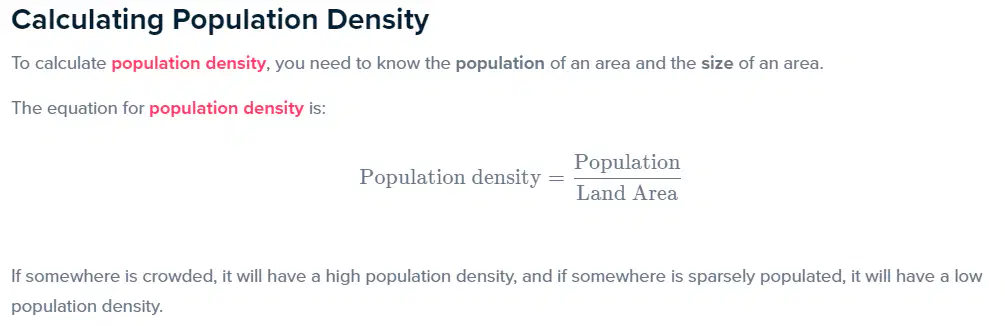
There are approximately 17,620 people per square mile in New York City. If New York City is 468 square miles, approximately how many people live in New York City?
a)
17,620
b)
8,246,160
c)
37
d)
.027
102.
A city has a population of 8792 people. The area of the city is approximately 6.5 square miles. Approximately, how many people per square mile live in the city?
a)
57148
b)
208
c)
1353
d)
135
103.

The number of deaths compared to the total number of people in a population

a)

death rate

b)

doubling time

c)

population decline

d)

birth rate

104.
The number of births compared to the total number of people in a population
a)
death rate
b)
birth rate
c)
baby boom
d)
doubling time
105.

Which of the following is NOT a challenge to a growing population?

a)

Overcrowding

b)

Housing shortages

c)

Overuse of resources

d)

Increased food supplies

106.
The movement of people from place to place
a)
Migration
b)
Urbanization
c)
Modernization
d)
Industrialization
107.

Leaving one's home to live in a new place

a)

Emigration

b)

Immigration

c)

Urbanization

d)

Ruralization

108.

To enter and live in a new country

a)

Emigration

b)

Immigration

c)

Urbanization

d)

Industrialization

109.

  1. With a population density of 8,355 people/km² and an area of 605 km², what is the population of Berlin? (Round to nearest whole number)


(a)  

110.

  1. With an area of 467 km² and a population of 1,324,171, what is the population density of Barcelona to the nearest whole number?


(a)  

111.

What do limiting factors do?

a)

Separate biotic factors from abiotic factors.

b)

Determine which is the predator and which is the prey.

c)

Regulate how many organisms live in an ecosystem.

d)

Determine which natural disasters will hit an area.

112.

Which of the following are abiotic limiting factors?

a)

The decomposers in an ecosystem.

b)

The populations of producers in a given habitat.

c)

Carrying capacities of several species.

d)

Water, space, and oxygen.

113.

Which of the following is a biotic limiting factor?

a)

The amount of breathable oxygen available to a population.

b)

Food available for organisms.

c)

The nitrogen to oxygen ratio in the air supply.

d)

The number of bodies of water in a habitat.

114.

In biology, what is carrying capacity?

a)

The maximum population size an ecosystem can support.

b)

A total list of the limiting factors.

c)

How much weight an organism can lift.

d)

How much pain an organism can tolerate.

115.

PREDATION is a form of interaction where......

a)

the organism that benefits is the predator

b)

the organism that benefits is the prey

c)

both organisms benefit

d)

neither organism benefits

116.

Match the following

a)
1.

Predation

b)
2.

Symbiosis

c)
3.

Commensalism

d)
4.

Parasitism

117.

What type of growth is this graph representing

a)

Logistical Growth

b)

Exponential Growth

118.

What type of growth is this graph representing?

a)

Logistical Growth

b)

Exponential Growth

119.

A condition that occurs when two or more organisms compete for the same resources

a)

competition

b)

predation

c)

parasitism

d)

mutualism

120.

Biotic or Abiotic factor that restricts the growth of the population

a)

carrying capacity

b)

limiting factor

c)

abiotic factor

d)

biotic factor

121.

In the graph to the right, what is the population of deer at the carrying capacity of the environment?

a)

3

b)

7

c)

70

d)

40

122.
What is the carrying capacity of the graph?
a)
around 500
b)
more than 500
c)
less than 500
d)
around 600
123.
What is the carrying capacity of the following graph?
a)
1000
b)
8000
c)
800
d)
600
124.

What will happen if all of the frogs in a population die?

a)

The frogs' predators will decrease and the frogs' prey will increase

b)

The frogs' predators will increase and the frogs' prey will decrease

c)

We better all pray because there isn't anymore frogs.
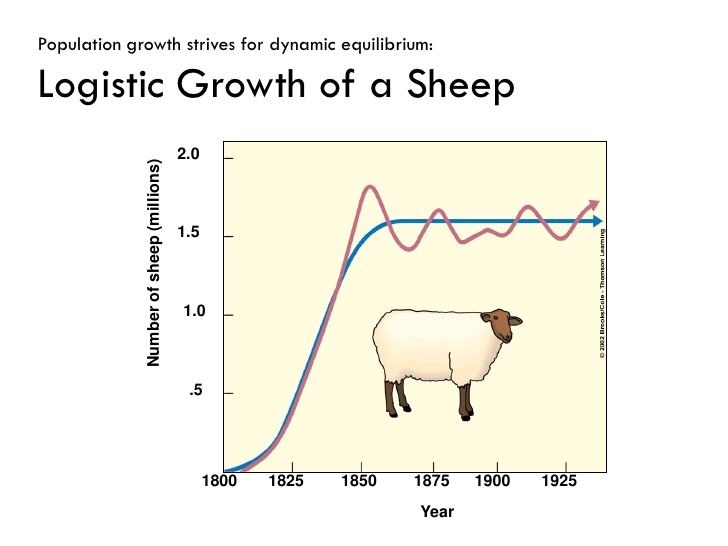
125.
What is the carrying capacity for this sheep population?
a)
1.8 million
b)
1.25 million
c)
1.6 million
d)
1.o million
126.
What point on the graph represents the carrying capacity?
a)
A
b)
B
c)
C
d)
D
127.
Food, water, sunlight, shelter, and space are resources that are  __________.
a)
limiting factors
b)
wet
c)
messy
d)
found in rocks
128.

Two arctic fox are fighting with a polar bear for a sea lion carcass. One fox distracts the bear while the other eats. What type of limiting factor is the polar bear?

a)

Predator-Prey Relationships

b)

Competition

c)

Herbivory Effect

d)

Weather

129.

A group of elephants gets stuck in mud at the edge of the river from a recent mud slide. A lion waits for an elephant to get tired before it attacks. What is the limiting factor to the elephant population?

a)

Predator-Prey Relationships

b)

Natural Disaster

c)

Herbivory Effect

d)

Competition

130.

When resources are not available a population will _____________ in size.

a)

Increase

b)

Decrease

c)

Stay the same

131.

Parasites and diseases will ______________ the size of a population, so the are examples of limiting factors.

a)

Increase

b)

Decrease

c)

Stay the same

132.

In many desert ecosystems, days are hot and nights are cold. Water is scarce, so animals seek water wherever possible. The spines of a cactus are actually leaves adapted to conserve water. The cactus plants have also adapted to live in thin, sandy soil. Which of the following is a biotic component of a desert ecosystem?

a)

the thin, sandy soil

b)

the wide temperature range

c)

the scarcity of water

d)

the spiny cactus leaves

133.

What happens if a population grows past its carrying capacity?

a)

The population keeps growing

b)

The population starts to die off

c)

The entire species will go extinct

d)

The carrying capacity just increases

134.
If a disease destroying barley plants in a field swept through an ecosystem, what would happen to the barley eating bird population in the the field ?
a)
The bird population would stay the same
b)
The bird population would infinitely increase
c)
The bird population would decrease
135.
When a specific population grows past the ecosystem's carrying capacity, what happens to the population?
a)
Density Independent limiting factors start to occur resulting in the population going farther above carrying capacity.
b)
Density Dependent limiting factors start to occur resulting in the population going back below carrying capacity.
c)
The population will go extinct due to lack of resources
d)
The population grows then finds a new carrying capacity
136.
What is the carrying capacity of the graph?
a)
around 500
b)
more than 500
c)
less than 500
d)
around 600
137.
What is the carrying capacity of the following graph?
a)
1000
b)
8000
c)
800
d)
600
138.

The total number of individuals that can survive in an habitat over time with the resources it has available.

a)
Carrying capacity
b)
Limiting factors
c)
Resources
d)
Population
139.
If the amount of food or resources available increases, the carrying capacity for an animal:
a)
Stays the same
b)
Increases
c)
Decreases
d)
Fluctuates
140.
Excessive amounts of rain caused a flood in the southwest United States that resulted in substantial amounts of deaths in the rabbit population? This situation is an example of a density _____________ limiting factor.
a)
density-independent
b)
density-dependent
c)
density- too high
d)
density- too low
141.

Natural disasters can be considered limiting factors.

a)

true: density independent limiting factors

b)

false; natural disasters are not limiting factors

c)

true: density dependent limiting factors

d)

false: because Ms. Hardin said so

142.
Limiting factors which impact the size of a population no matter how large that population is.
a)
Density Independent Limiting Factors
b)
Density Dependent Limiting Factors
c)
Carrying Capacity
d)
Exponential Growth
143.
An environmental factor such as storms and extreme heat or cold that decrease a population are considered to be. 
a)
density- dependent factor
b)
population density
c)
dispersion
d)
density- independent factor
144.

A lion and a cheetah attempt to occupy the same niche. The more aggressive lion survives; the cheetah does not.

a)

Density-Dependent: Competition

b)

Density-Independent: Competition

c)

Density-Dependent: Predator-Prey

d)

Density-Independent: Predator-Prey

145.

Coyotes cross the winter pack ice and enter Newfoundland. The moose population starts to decline.

a)

Density-Dependent: Competition

b)

Density-Independent: Competition

c)

Density-Dependent: Predator-Prey

d)

Density-Independent: Predator-Prey

146.

A severe frost wipes out 50% of the coffee crop in Brazil.

a)

Density-Dependent

b)

Density-Independent

147.

Due to severe overcrowding in an Asian village, many children do not survive to reach adulthood.

a)

Density-Dependent: Disease

b)

Density-Independent: Disease

148.

Since lynx prey on hares, an increase in the hare population causes an increase in the lynx population.

a)

Density-Dependent: Competition

b)

Density-Independent: Competition

c)

Density-Dependent: Predator-Prey

d)

Density-Independent: Predator-Prey

149.

A severe flood in the Red River Valley causes a decline in the deer population.

a)

Density-Dependent

b)

Density-Independent

150.

Due to stress, large numbers of female lemmings miscarry their young and fail to reproduce.

a)

Density-Dependent

b)

Density-Independent

151.

Travelers who visit a crowded African village become infected with a disease caused by parasites.

a)

Density-Dependent

b)

Density-Independent

152.

Many fish die due to a change in the winds and the appearance of the El Nino ocean current off the coast of Peru and Chile.

a)

Density-Dependent

b)

Density-Independent

153.

Fish on a coral reef stake out their territory and chase away any younger fish that try to live there.

a)

Density-Dependent

b)

Density-Independent

154.

An extensive drought in the Serengeti Plain threatens wildebeest, giraffe, zebra, and springbok populations.

a)

Density-Dependent

b)

Density-Independent