
 Worksheets
Unit 3 Review
Total questions: 124
Worksheet time: 10hrs 12mins

Which country, A or B, has an ageing population?
A
B

Predict the future population growth of this country.
Negative Growth (the population will shrink)
Slow/No Growth (the population will stay about the same)
Growth (the population will definitely grow)
Fast Growth (the population will explode)

By 2025 the UK will have... (pick 2)
a narrower base meaning fewer young children
a wider top meaning more older people
a wider base meaning more young children
a narrower top meaning fewer older people

Is this country Developed or Developing?
Developed
Developing

What age groups does the bottom of a population pyramid represent?
The elderly
The working adults
The children
Males

What does the whole right side of the population pyramid represent?
Males
Females
Unemployed
Young people

What age group does the top of the population pyramid represent?
The working people
The rich people
The elderly
The young people

What growth rate does this population pyramid represent?
Rapid Growth
Slow Growth
Negative Growth
Zero Growth

Predict the future population growth of this country.
Negative Growth (the population will shrink)
Slow/No Growth (the population will stay about the same)
Growth (the population will definitely grow)
Fast Growth (the population will explode)
Predict the future population growth of this country.
Negative Growth (the population will shrink)
Slow/No Growth (the population will stay about the same)
Growth (the population will definitely grow)
Fast Growth (the population will explode)

The age group that provides the most support for the other groups is:
Young population
Working population
Old population

Which growth rate does this population pyramid represent?
Slow Growth
Zero Growth
Rapid Growth
Negative Growth

Based on this country's population pyramid, their population is
Increasing
Stable
Decreasing

Based on this country's population pyramid, their population is
Increasing
Stable
Decreasing


Exponential Growth occurs when-
populations have plenty of food/space
home to keystone species
have few evasive species in a habitat
have little to no competition or predators
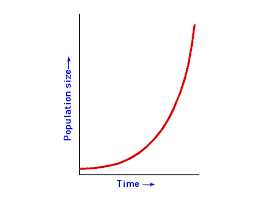
What type of growth is shown in the diagram?
exponential growth
logistic growth
predator-prey cycle
boom-bust curve

What is the approximate carrying capacity of Paramecium aurelia grown alone?
100
200
300
450

The type of growth represented by this graph is exponential/logistic population growth.
logistic
linear
exponential
random
The term ecologists use to describe the number of individuals moving away from a population is
Emigration
Immigration
The term ecologists use to describe the number of individuals moving into a population is
Emigration
Immigration
Factors that affect population size:
INCREASE: Number of ___________ & ____________
(Choose 2 answers)
Birth
Death
Immigration
Emigration
Factors that affect population size:
DECREASE: Number of ___________ & ____________
Choose all that applies.
Birth
Death
Immigration
Emigration

Is this graph showing exponential growth or logistical growth?
Exponential
logistical

Look at this image- What is the carrying capacity of this population?
21
5000
2000
1000

As resources become less available the growth of a population
slows or stops
decreases or increases
up or down
in or out
Which of the following demonstrates population growth when there is limited available water in an area?


When Yellowstone National Park was created in the late 1800s, wolves were on the decline. The last wolves in Yellowstone were killed in 1926, but in the 1800s, there were between 100-160 wolves in the park. In 1995, gray wolves were reintroduced to the park.
Which graph (drawn in red) below shows a prediction of how the population would change if there was less water available in the ecosystem?


There would be no change to carrying capacity.

The curve line represents the growing population. What made it slow and stop?
they kept growing
it reached carrying capacity
because they wanted to stop

Will a wildfire make the carrying capacity of an ecosystem increase or decrease?
increase
not effected
decrease

The ability to reproduce under ideal conditions, enough space, food, water, lack of predators.
Primary Consumers
Pioneer Species
Biotic Potential
Abiotic Factors

What are survivorship curves?
curves that describe the number of survivors over time
curves that tell us what the limiting factors are
curve that tells us about the carrying capacity
a curve
Why don't populations grow indefinitely?
limiting factors
only biotic factors
only abiotic factors
none of the above
The exponential graph is a graph that shows us population size increasing quickly, which one below shows us that


Type 2 curve shows us
deaths at the end
the graph going down
constant death at all stages
death at the beginning

Type 3 graphs show
Some death rates
Death rates through out
Death rates at older ages
High death rates at a young age
Type 1 curve represents what type of group
Birds
Humans
Trees and plants
Marine life

Tracks organisms that tend to live long lives (low death rate and high survivorship rate); toward the end of their life expectancies, however, there is a dramatic increase in the death rate.
Type I
Type II
Type III
Type IV
Describes organisms with a high death rate (or low survivorship rate) immediately following birth. Examples include bacteria, fishes, and invertebrates.
Type I
Type II
Type III
Type IV
These organisms typically live in unstable, unpredictable environments & are able to reproduce rapidly (exponentially). They do not take care of their young & are subject to predation.
k-strategist
r-strategist
m-strategist
s-strategist
These organisms occupy stable environments, are larger in size and have longer life expectancies. They produce, during their life spans, fewer offspring, but place a greater investment in each.
k-strategist
r-strategist
m-strategist
s-strategist
What is a density-dependent factor?


What growth rate does this population pyramid represent?

RAPID GROWTH

SLOW GROWTH

STABLE

DECLINING

What growth rate does this population pyramid represent?
RAPID GROWTH
SLOW GROWTH
STABLE
DECLINING

Which country is the less developed of the two?
Kenya
Japan
Both are of equal development
None of the above
What is a possible reason for Kenya having a “bottom heavy” pyramid?
Industrialization is at its peak
There is a significant lack of quality medical care
Higher education is readily available to the population
Migratory populations have negative immigration issues

The survival curve of modern humans and many large mammals is described as -
Type I - Where the probability of survival is high until relative old age, and then declines rapidly.
Type III - Very few organisms survive their younger years.
Type II - A straight line, with a constant slope, that decreases over time toward zero.
Certain lizards, perching birds, and rodents exhibit this type of survivorship curve?
Type I - Where the probability of survival is high until relative old age, and then declines rapidly.
Type III - Very few organisms survive their younger years.
Type II - A straight line, with a constant slope, that decreases over time toward zero.
Trees, marine invertebrates, and most fish have this type of survivorship curve?
Type I - Where the probability of survival is high until relative old age, and then declines rapidly.
Type III - Very few organisms survive their younger years.
Type II - A straight line, with a constant slope, that decreases over time toward zero.
Which of the following is a density dependent factor?
volcanic eruption
earthquake
disease
hurricane
A small island nation is tracking its total population. It started with exactly 100 people. During the year, 10 people immigrated, while 20 emigrated. The birth rate was 15, and the death rate was 5. What is the new population of the country?
115
110
90
No change; the population is still 100.

The graph to the right shows the interaction of the wolf and moose populations on Isle Pekie. If the moose population continues to increase, the wolves' food supply will increase. What will most likely happen to the wolf population as a result?
It will decrease.
It will increase.
It will remain the same.
There is a population of beetles that has 2000 individuals. In one month, there are 300 births and 125 deaths. Calculate the growth rate.
A population of 400 butterflies exhibits logistic growth. The growth rate is 0.1 and the carrying capacity is 600 butterflies. How many individuals are added to the population in one generation?
Yay Butterflies
No butterflies (DONT PICK THIS)
You collect the following information during a one-year period. There are 1,000 deer at the start of the year on the island; 80 deer die, 150 deer are born, 20 immigrate, and 15 emigrate. Calculate the growth rate.
0.070
0.075
0.065
0.010
You set raccoon traps around an area and find that the population of raccoons is approximately 1,000. Over the course of the next year, you determine that 300 raccoons are born and 290 die. Calculate the growth rate.
0.01
0.10
0.03
0.11
England had 12 births for every 1,000 people in a year. This is
Crude Birth Rate
Crude Death Rate
Natural Increase Rate
Doubling Time
The CBR of Togo is 30 and the CDR is 10. What is r?
20%
40%
2%
6%
This species classification is usually characterized by exponential growth.
R-Selected
K-Selected
An organism that exhibits high parental care would be likely considered
r-selected
K-selected
Type 3 survivorship
A mouse with a short life span, produces more offspring than can survive, and gives little or no parental care is a
R-selected species
K-selected species
An elephant that has only 1 offspring at a time, has a long life span, and provides parental care throughout maturity is a
K- selected species
R-selected species

A pattern of survival over time in which there is high survival throughout most of the life span, but then individuals start to die in large numbers as they approach old age.
Type i survivorship
Type ii survivorship
Type iii survivorship

A pattern of survival over time in which there is a relatively constant decline in survivorship throughout most of the life span.
Type ii survivorship
Type i survivorship
Type iii survivorship

A pattern of survival over time in which there is low survivorship early in life with few individuals reaching adulthood.
Type III survivorship
Type II survivorship
Type I survivorship
These organisms have:
Long life span
Long period of gestation-pregnancy
Long term care of babies until maturity
Have few babies
K-strategist
R-strategist
H-strategist
These organisms have:
Short life span
Short gestation-pregnancy
Very little care for babies
Produce more offspring that can survive
R-strategist
K-strategist
H-strategist
A city has a current population of 500,000 and an annual growth rate of 2.5 percent. Assuming the growth rate stays the same, what will be the population of this city in 30 years?
750,000
1 million
2 million
3 million
A town currently has a population of 600,000 and an annual growth rate of 3 percent. Assuming the growth rate remains constant, what will be the population of this town in 25 years?
1 million
1.2 million
1.5 million
2.5 million

At what stage does this population reach it's carrying capacity on the Demographic Transition Model (a)
A small developing country with negligible rates of immigration and emigration is going through a demographic change. Thirty years ago the crude birth rate was 44 per thousand per year and the crude death rate was 17 per thousand per year. Now the crude birth rate is 16 thousand per year and the crude death rate is 5 per thousand per year. Which of the following statements about the country now is most likely to be true?
The growth rate of the population is increasing.
The country is at the preindustrial stage of the demographic transition.
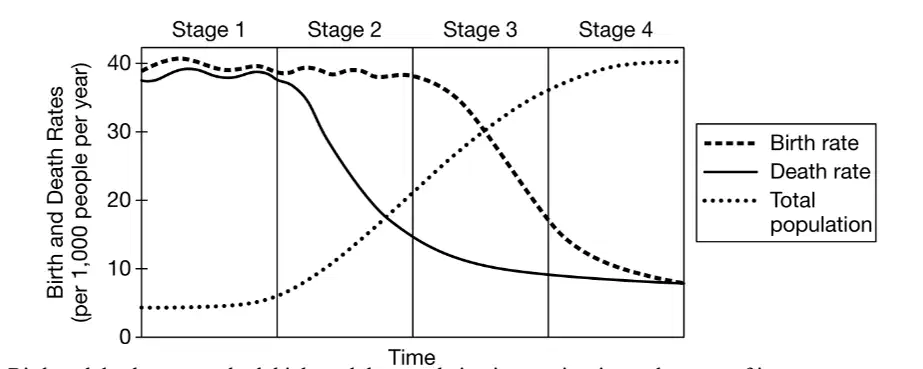
Which of the following best describes a country in stage 2 of the demographic transition, based on the model shown below?
Birth and death rates are both high, and the population is experiencing a slow rate of increase.
Birth and death rates are both low, and the population is stable.
Birth rates are high and death rates are declining, and the population is increasing rapidly.
Birth rates are low and death rates are high, and the population is declining rapidly.
Which of the following describes the changes in a country’s demographics as it begins its transition from a preindustrial state to an industrial state?
Population increases rapidly, birth rate declines, death rate increases
Population increases rapidly, birth rate declines, death rate remains high
Population decreases rapidly, birth rate declines, death rate decreases
Population decreases rapidly, birth rate remains high, death rate increases
Population increases rapidly, birth rate remains high, death rate decreases
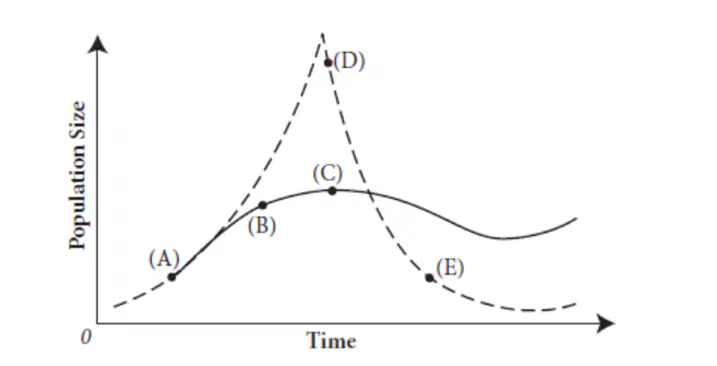
PICK B
A
B
E
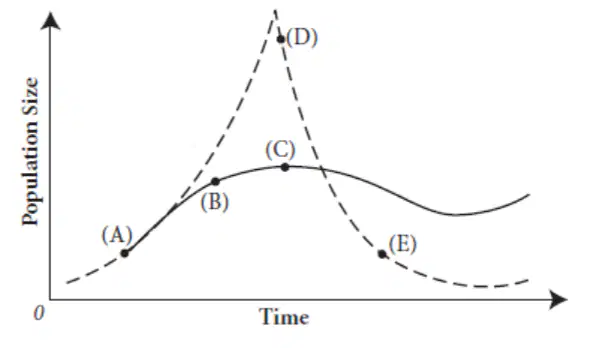
The curves show two possible patterns of change in population size. Which point shows population increasing at the fastest rate?
A
B
C
D
E
Which of the following factors can influence the birth rate in a human population?
I. Access to healthcare
II. Urbanization and industrialization
III. Availability of family planning services
I only
II only
III only
I and II only
I, II, and III
What characterizes a population with a stable age structure?
A population with a constant birth rate and fluctuating age distribution
A population where the age distribution remains unchanged over time
A population experiencing rapid growth with varying age proportions
A population with a declining birth rate and stable age distribution
A population in which the age distribution changes with each generation

During which phase of the demographic transition does a country experience a decline in birth rates while the population continues to grow?
The preindustrial
The pretransitional
The transitional
The industrial
The postindustrial
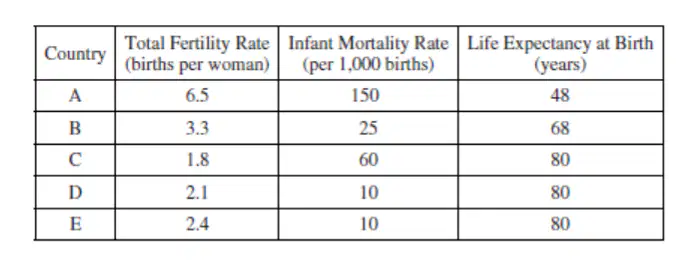
Which country from the list above is likely facing an aging population issue?
A
B
C
D
E
What is a common effect of a society's progression through the demographic transition on its total fertility rate?
The total fertility rate increases as the society becomes more industrialized.
The total fertility rate remains constant regardless of the demographic transition.
The total fertility rate decreases as the society progresses through the demographic transition.
The total fertility rate is unaffected by changes in women's education levels.
The total fertility rate is higher in societies with a larger elderly population.
More people living in poverty
More developed
Less developed
Lower birth rate
More developed
Less developed
Less people working on farms
More developed
Less developed

Which describes the birth and death rate of Stage 1 of the demographic transition model?
The death rate is high but the birth rate is low
Both the death and birth rate are high
The death rate is low but the birth rate is high
Both the death and birth rate are low

Which describes the birth and death rate of Stage 2 of the DTM?
The death rate is decreasing and birth rate remains high
Both the death and birth rate are high
The death rate is low but the birth rate is high
Both the birth rate and death rate are decreasing
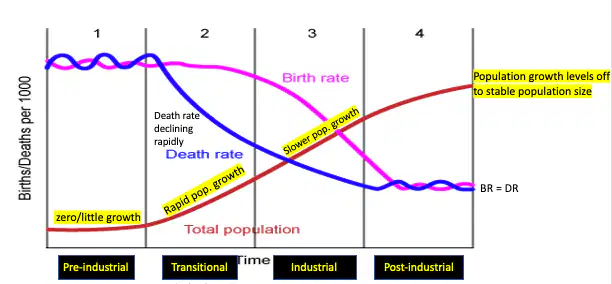
Which describes the birth and death rate of Stage 3 of the DTM?
The death rate is decreasing and birth rate remains high
Both the death and birth rate are high
The death rate is low but the birth rate is high
Both the birth rate and death rate are decreasing

Which describes the birth and death rate of Stage 4 of the DTM?
The death rate is decreasing and birth rate remains high
Both the death and birth rate are high
Both the death and birth rate are low and fluctuating
Both the birth rate and death rate are decreasing
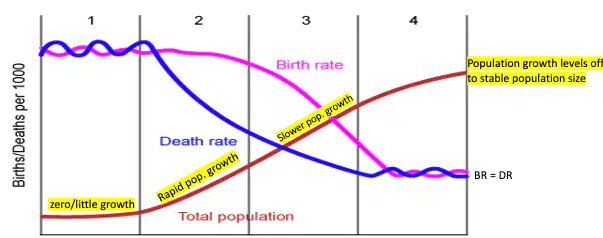
In which stage of the DTM is the total population growth the most rapid?
1
2
3
4
5

In Stage 1, the birth rate is...
High
Falling
Low

In Stage 1, the death rate is...
High
Falling
Low

In Stage 1, the Total Population is...
Mostly stable - growing slowly
Growing quickly
Decreasing

In Stage 2, the birth rate is...
High
Falling
Low

In Stage 2, the Death rate is...
High
Falling Quickly
Low

In Stage 2, the Total Population is...
Growing Slowly
Growing Quickly
Not Growing

In Stage 3, the Birth Rate is...
High
rapidly Dropping
Low

In Stage 3, the Death rate is...
High
Dropping slowly
Low

In Stage 3, the Total Population is...
Growing quickly
Slowing down
Decreasing

In Stage 4, the Birth rate is...
High
Rising
Low

In Stage 4, the Death rate is...
High
Rising
Low

In Stage 4, the Total Population is...
Growing Quickly
Leveling Out
Decreasing Quickly
In Stage 5, scientists believe the Total Population will...
Increase
Stay Steady
Decrease
In Stage 1, the Population Pyramid would look like. . .


In Stage 5, the Population Pyramid would look like. . .
A country has begun to get access to health care for women and children and there is better access to food resources and clean water. However, it is still very expensive to get access to reliable birth control so most women do not use it. What stage of the demographic transition is this country likely in?
Stage 1-Pre industrial
Stage 2- Transitional
Stage 3 - Industrial
Stage 4 - Post industrial
In Stage 1, the Population Pyramid looks like...


In Stage 2, the Population Pyramid looks like...


In Stage 3, the Population Pyramid looks like...


In Stage 4, the Population Pyramid looks like...


What stage is this country in?
Stage 1
Stage 2
Stage 3

What stage is this country in?
Stage 3
Stage 5
Stage 2

What stage is this country in?
Stage 1
Stage 3
Stage 5

In Stage 1, the widest part of the Population Pyramid is at the...
Top
Middle
Bottom

