
16Q
6th
10Q
8th - 10th
17Q
8th - 10th

19Q
8th - 10th
50Q
7th - 12th
16Q
6th - 8th
30Q
9th - Uni
20Q
10th - Uni
21Q
9th - 12th
8Q
5th - 7th
16Q
10th
15Q
12th
20Q
7th
15Q
9th
13Q
7th
10Q
6th
20Q
3rd
13Q
3rd
21Q
9th
16Q
8th - 10th
13Q
8th
16Q
6th
20Q
Uni
17Q
5th
Explorar hojas de trabajo por materias
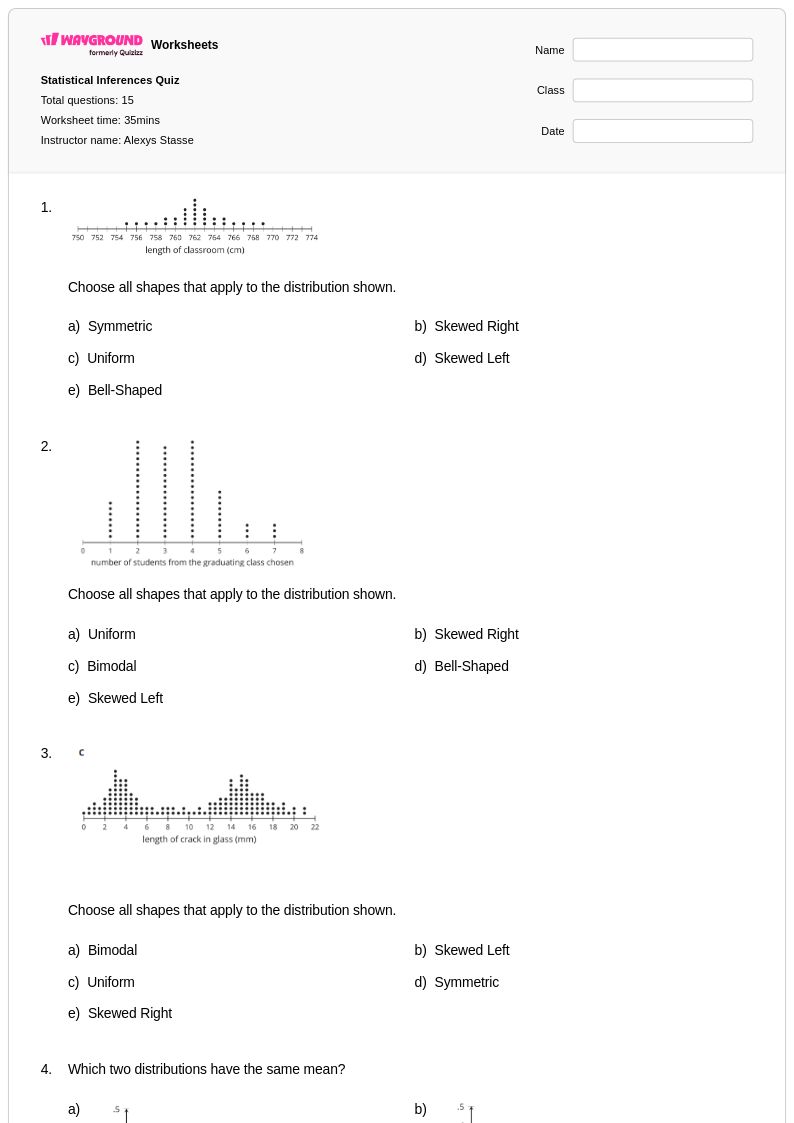
Explore printable Shapes of Distributions worksheets
Shapes of distributions worksheets available through Wayground (formerly Quizizz) provide comprehensive practice materials that help students develop critical statistical literacy skills by analyzing and interpreting the visual patterns found in data sets. These educational resources strengthen students' ability to identify key characteristics of distributions including symmetry, skewness, modality, and outliers while building foundational understanding of how data behavior impacts statistical analysis. The worksheet collections feature varied practice problems that guide learners through examining histograms, box plots, and dot plots to recognize normal distributions, right-skewed and left-skewed patterns, uniform distributions, and bimodal shapes. Each printable resource includes detailed answer keys that support independent learning and self-assessment, with free pdf formats ensuring accessibility for diverse classroom environments and home study applications.
Wayground (formerly Quizizz) empowers educators with millions of teacher-created worksheet resources specifically designed for shapes of distributions instruction, featuring robust search and filtering capabilities that allow quick identification of materials aligned to specific statistical standards and learning objectives. The platform's differentiation tools enable teachers to customize worksheet difficulty levels and problem types to meet individual student needs, whether providing remediation for struggling learners or enrichment challenges for advanced students. These comprehensive collections are available in both printable pdf formats for traditional classroom use and digital formats for technology-integrated instruction, supporting flexible lesson planning across diverse teaching environments. Teachers can efficiently locate targeted practice materials for skill-building sessions, formative assessments, and review activities that reinforce students' ability to analyze distribution shapes and connect visual patterns to underlying data characteristics.