
9 Q
9th
16 Q
8th - 10th
19 Q
9th
18 Q
12th
16 Q
8th
15 Q
6th
11 Q
9th - 12th
16 Q
6th - 8th
15 Q
9th
10 Q
6th
20 Q
11th - 12th
16 Q
6th - 8th

16 Q
9th
9 Q
6th
14 Q
9th - 12th
20 Q
9th
12 Q
6th
15 Q
6th

11 Q
6th - 10th
15 Q
9th - 12th
20 Q
9th
14 Q
9th
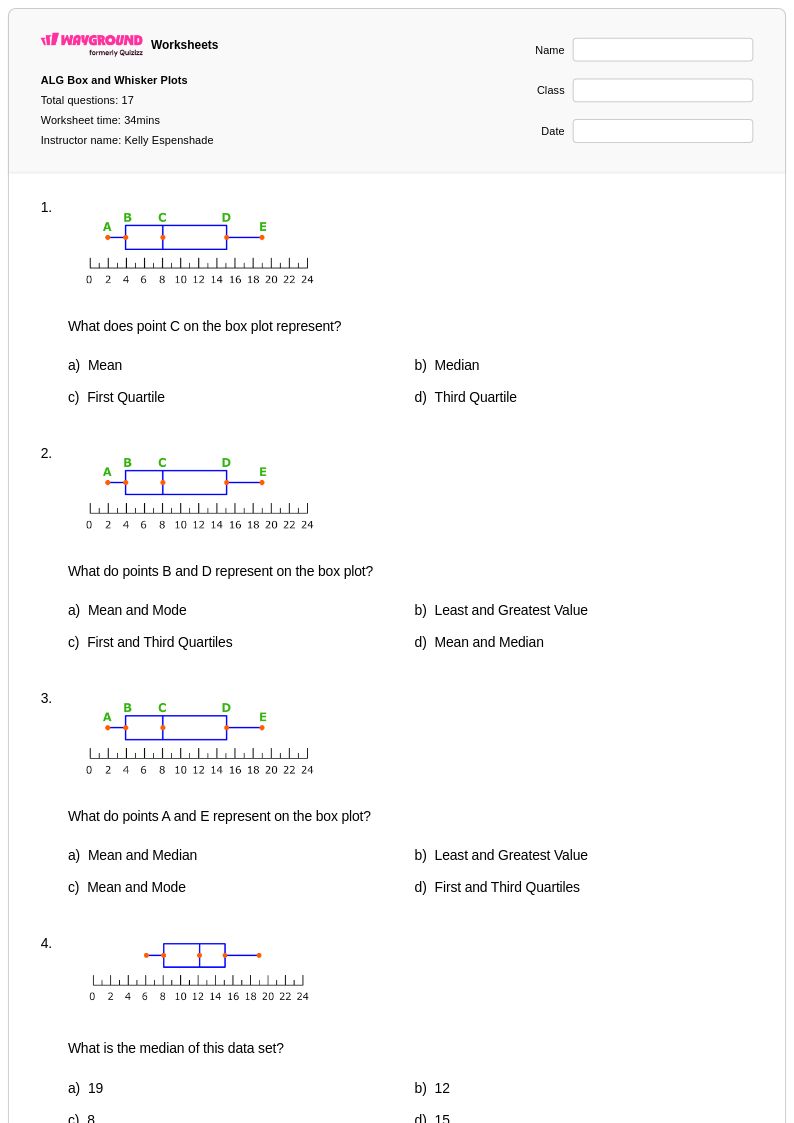
17 Q
9th
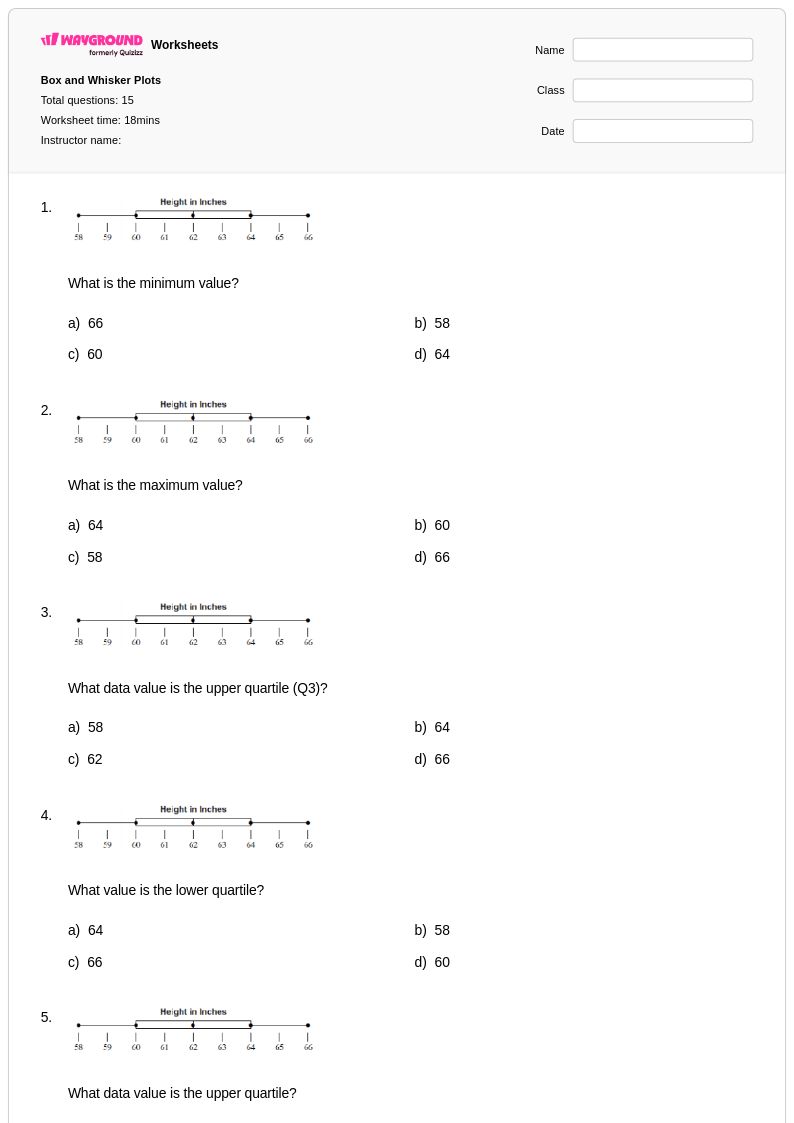
15 Q
7th
Explore Worksheets by Subjects
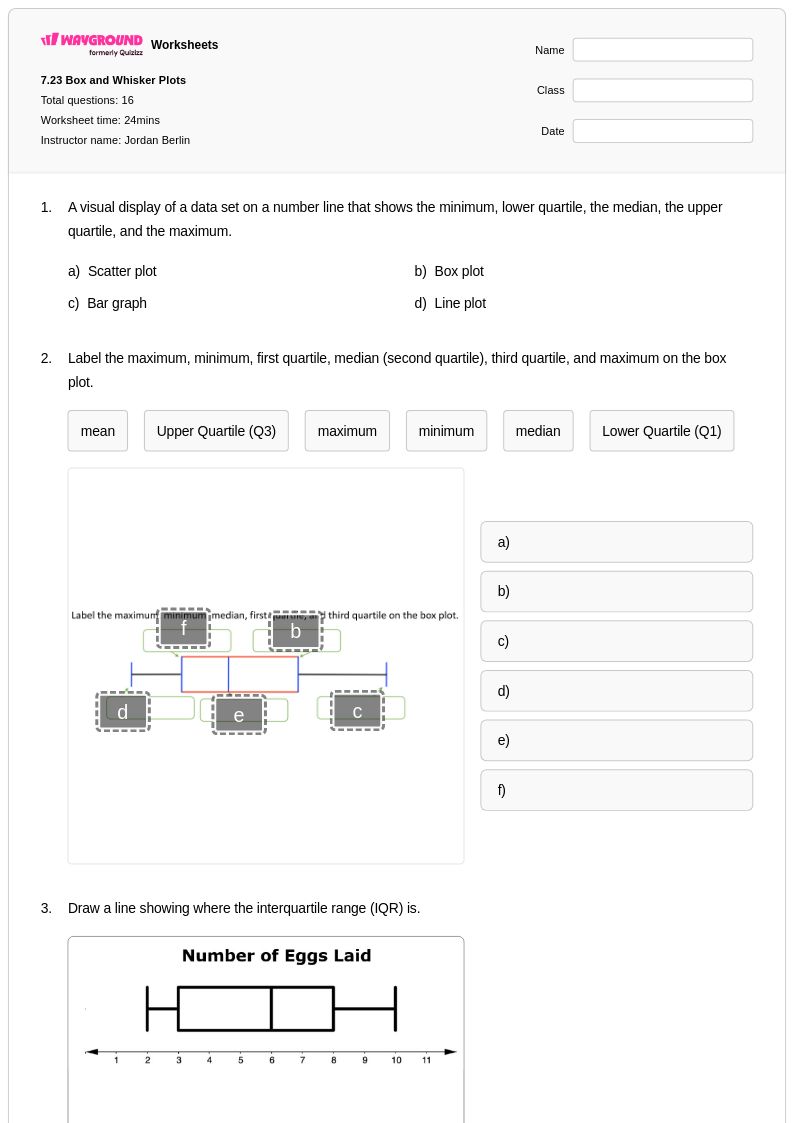
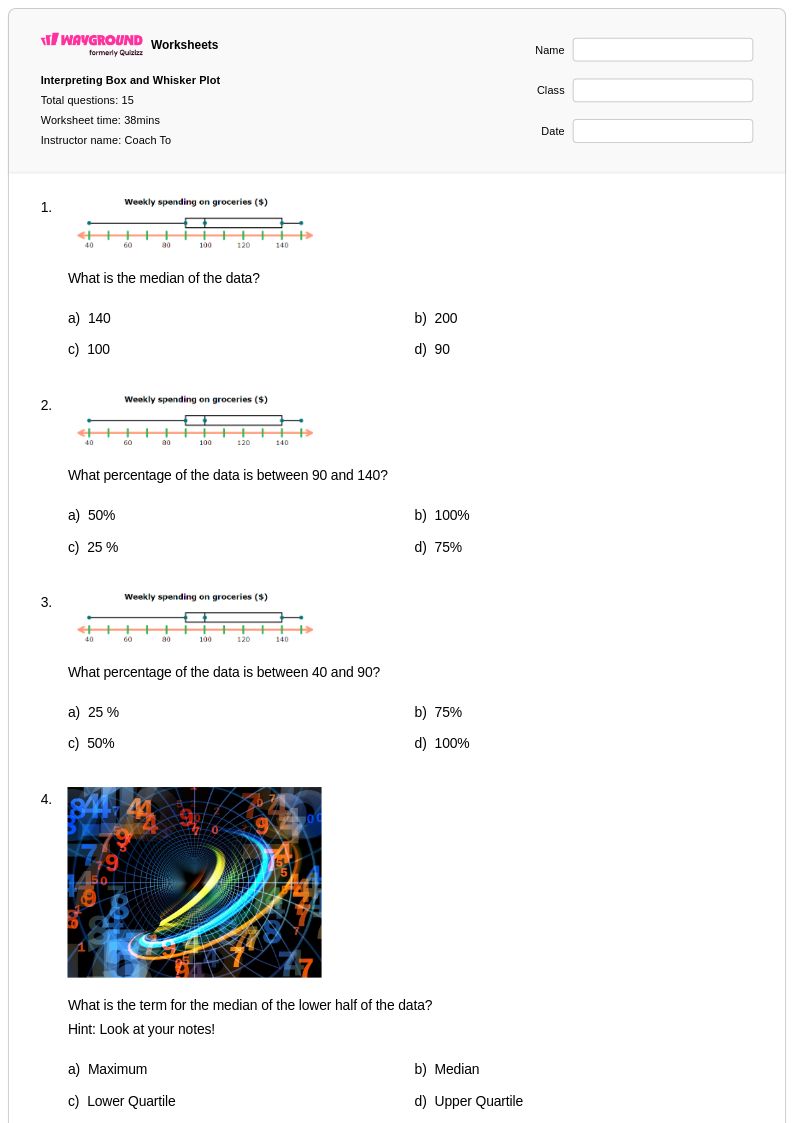
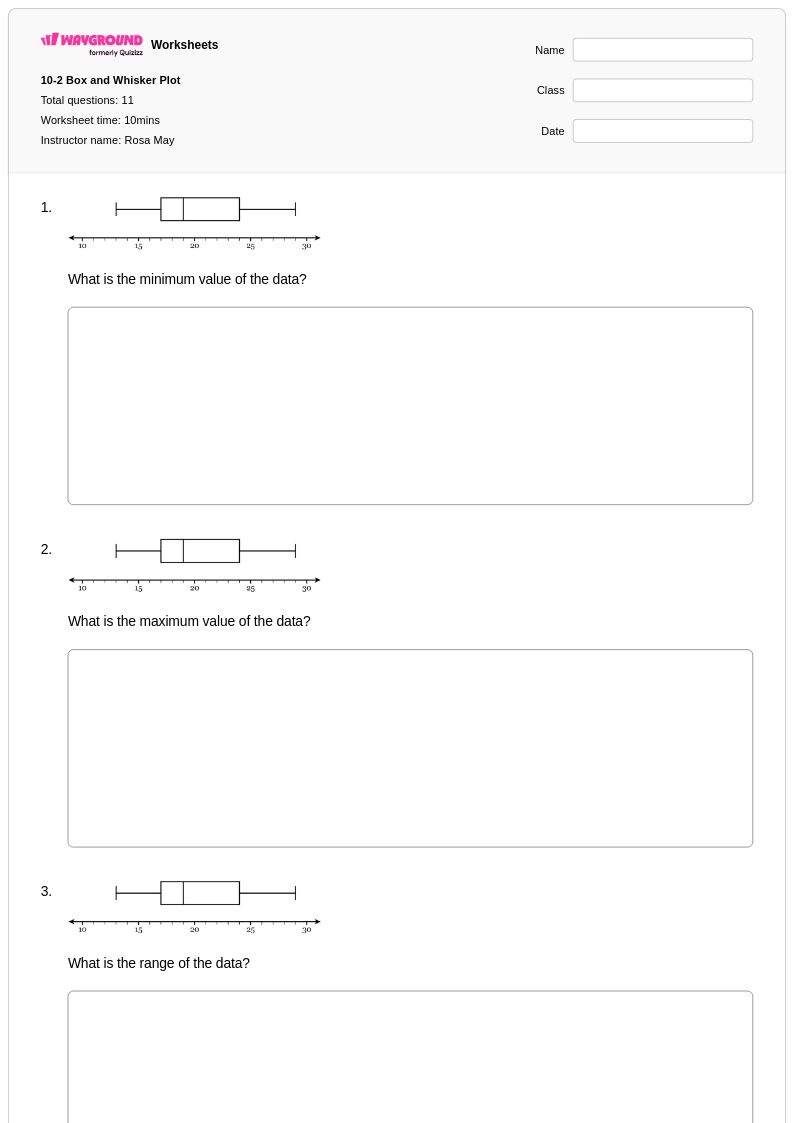
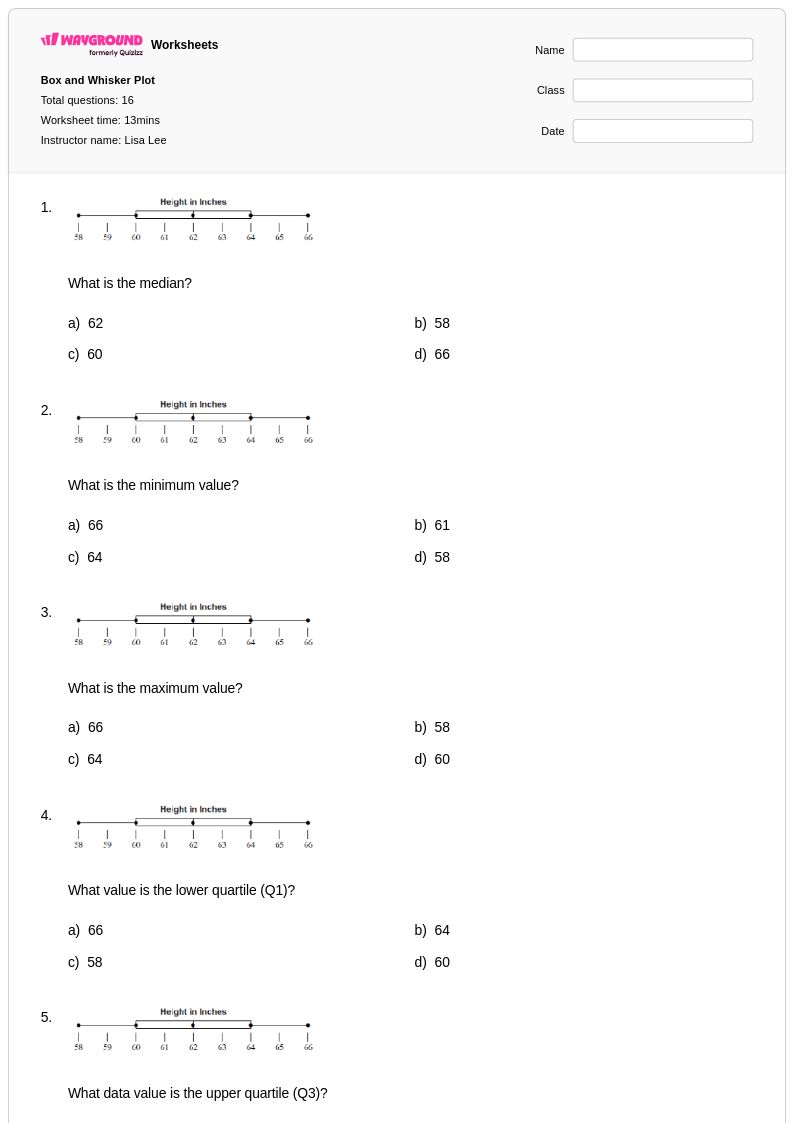
Explore printable Box and Whisker Plot worksheets
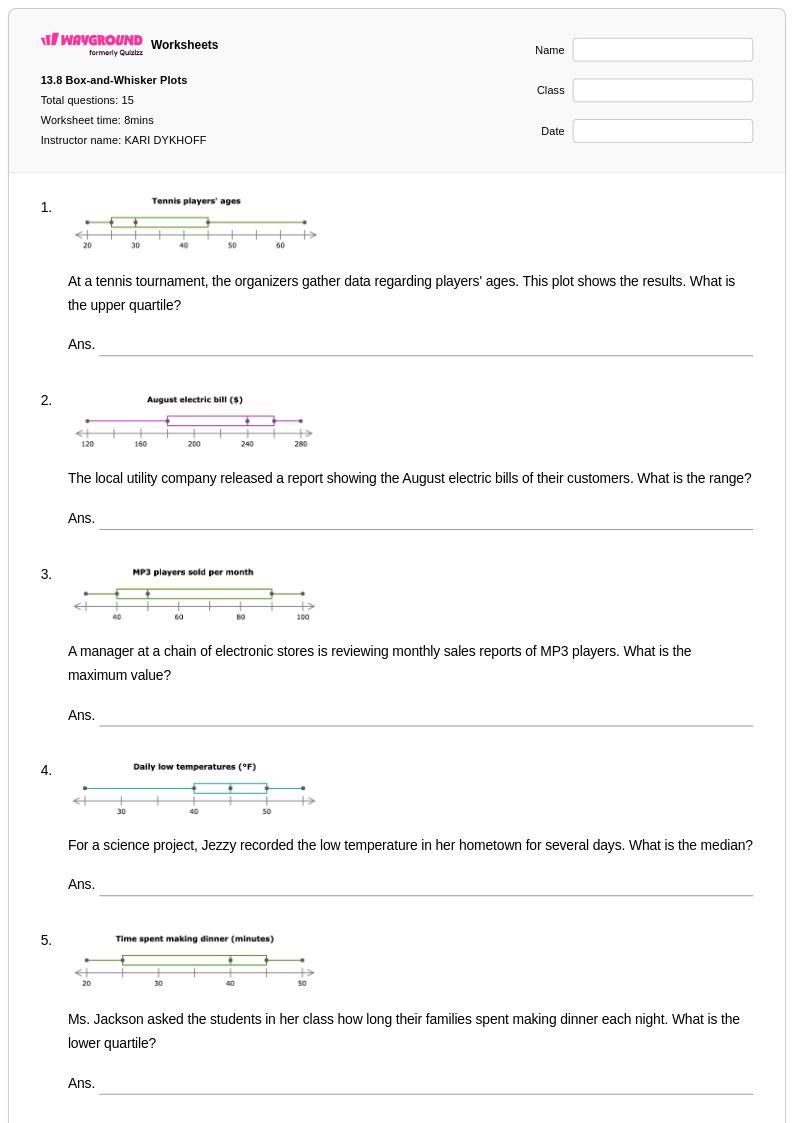
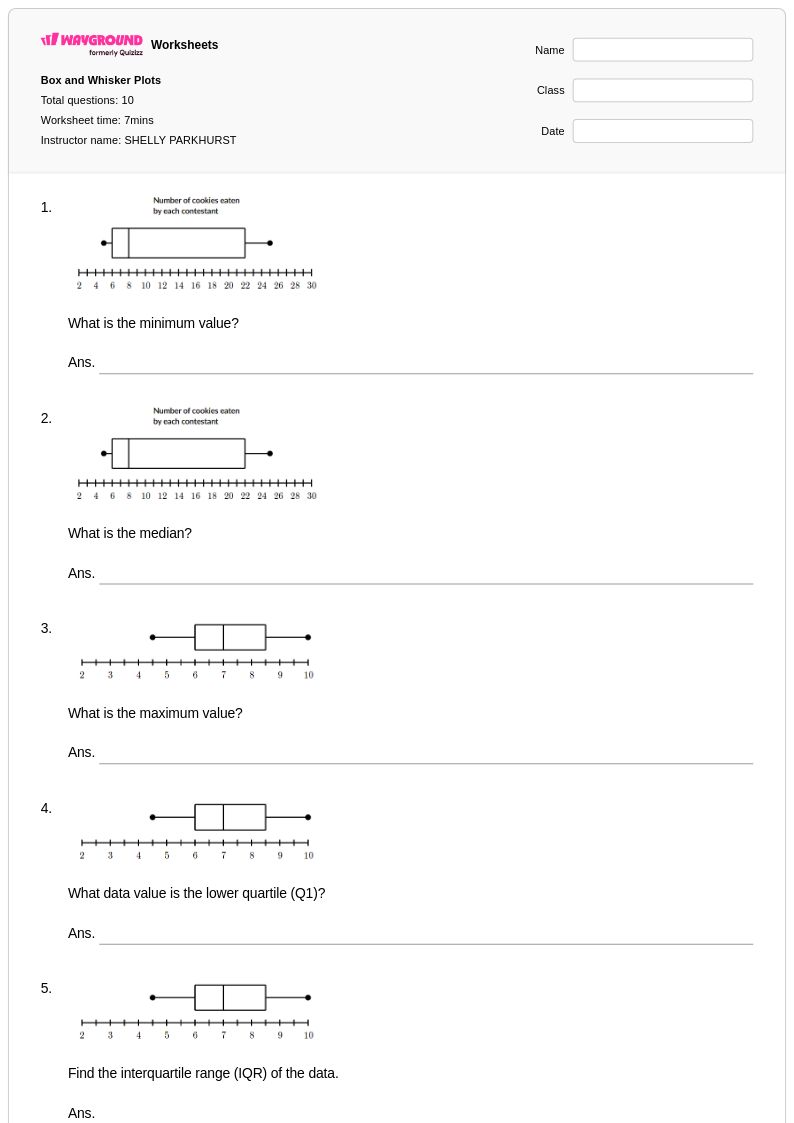
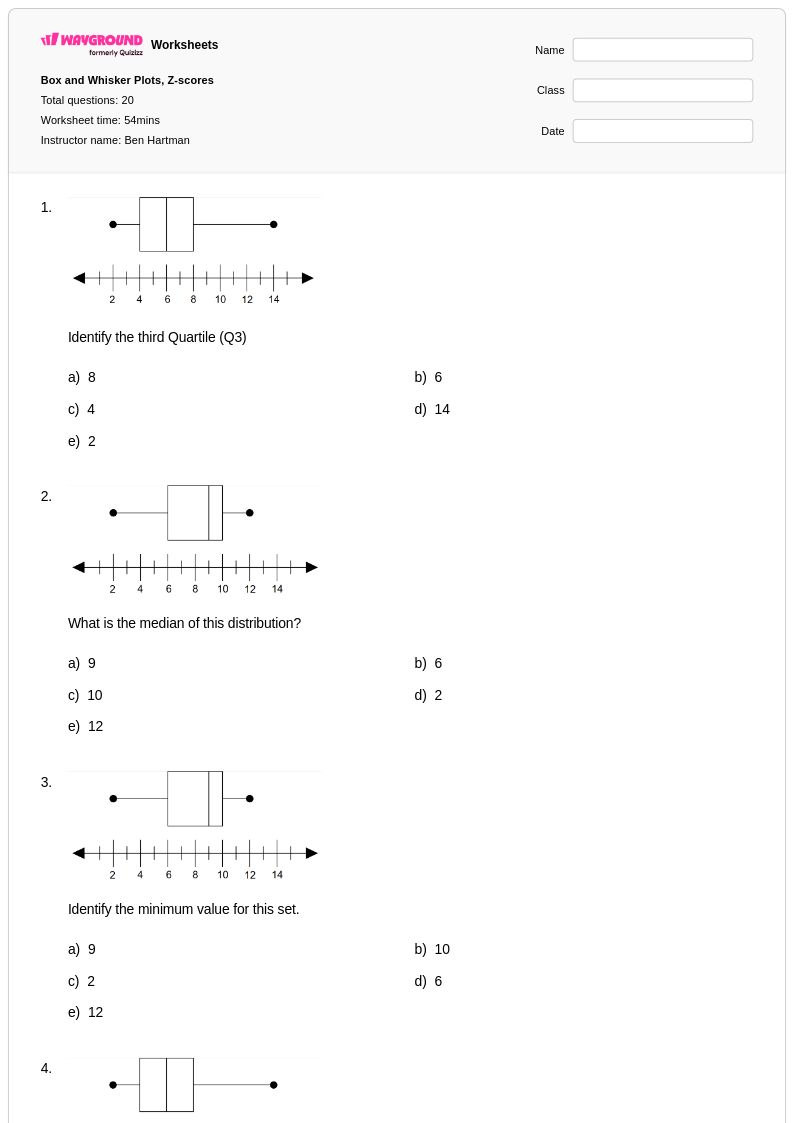
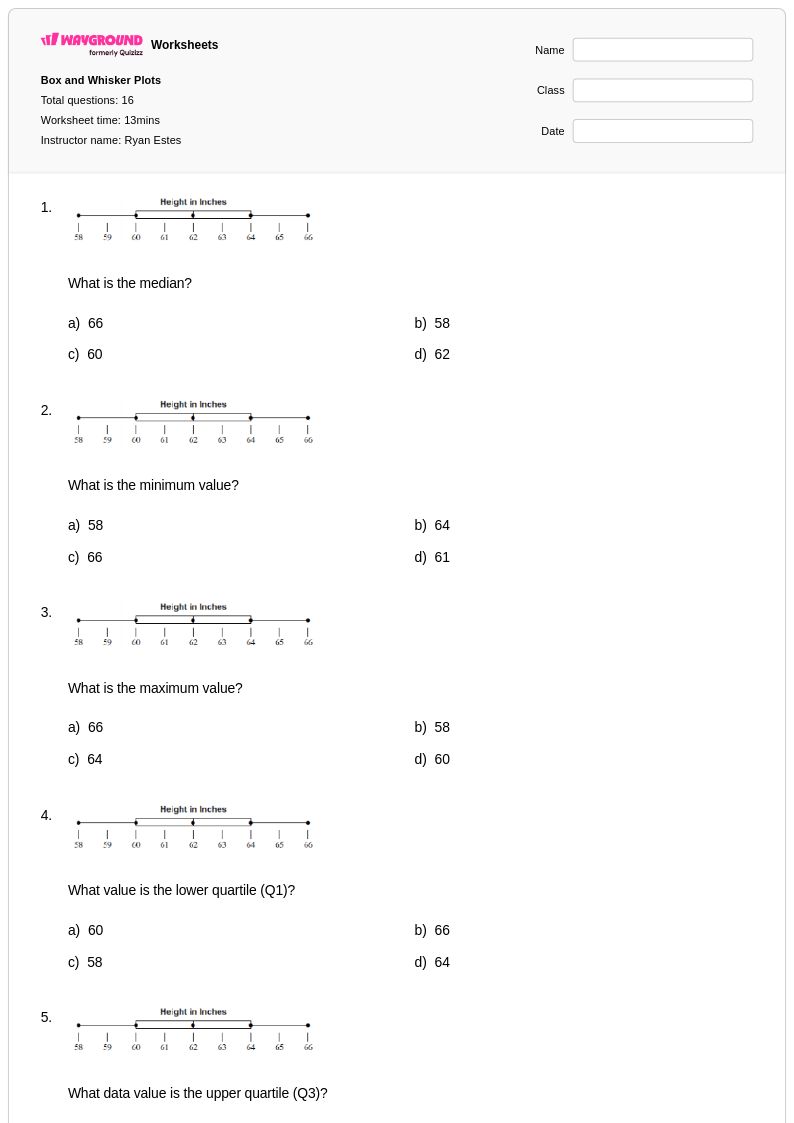
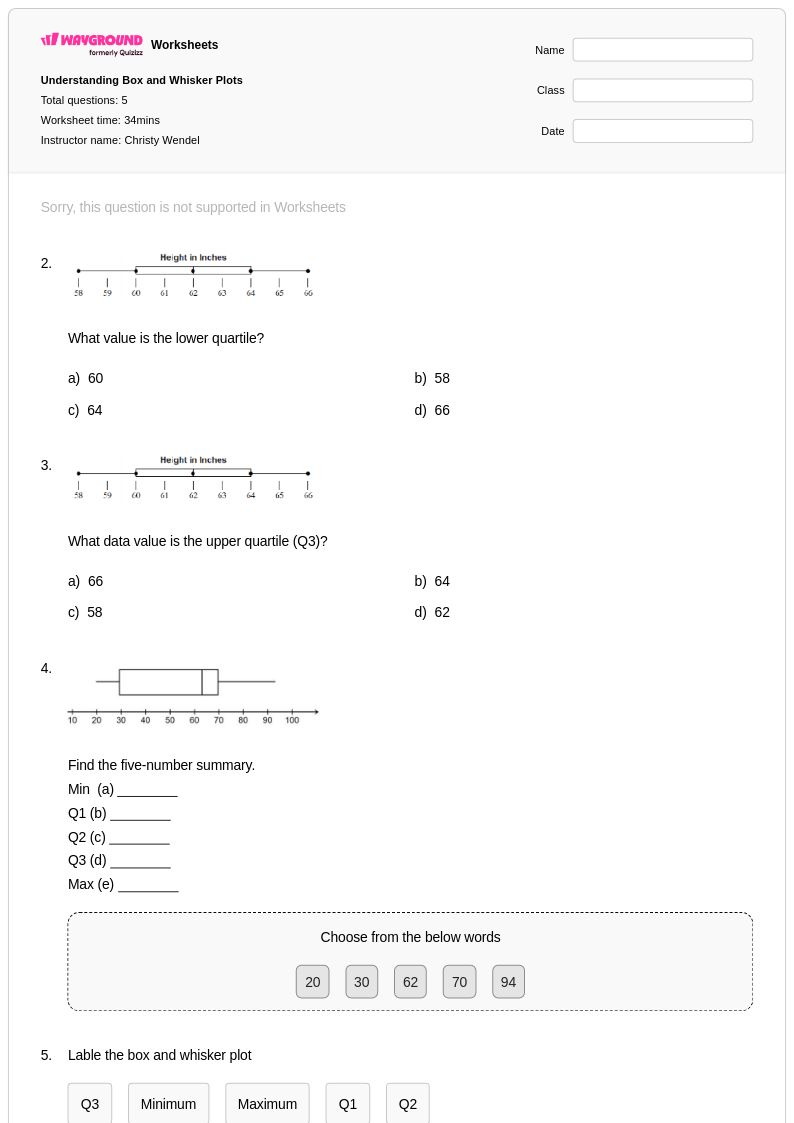
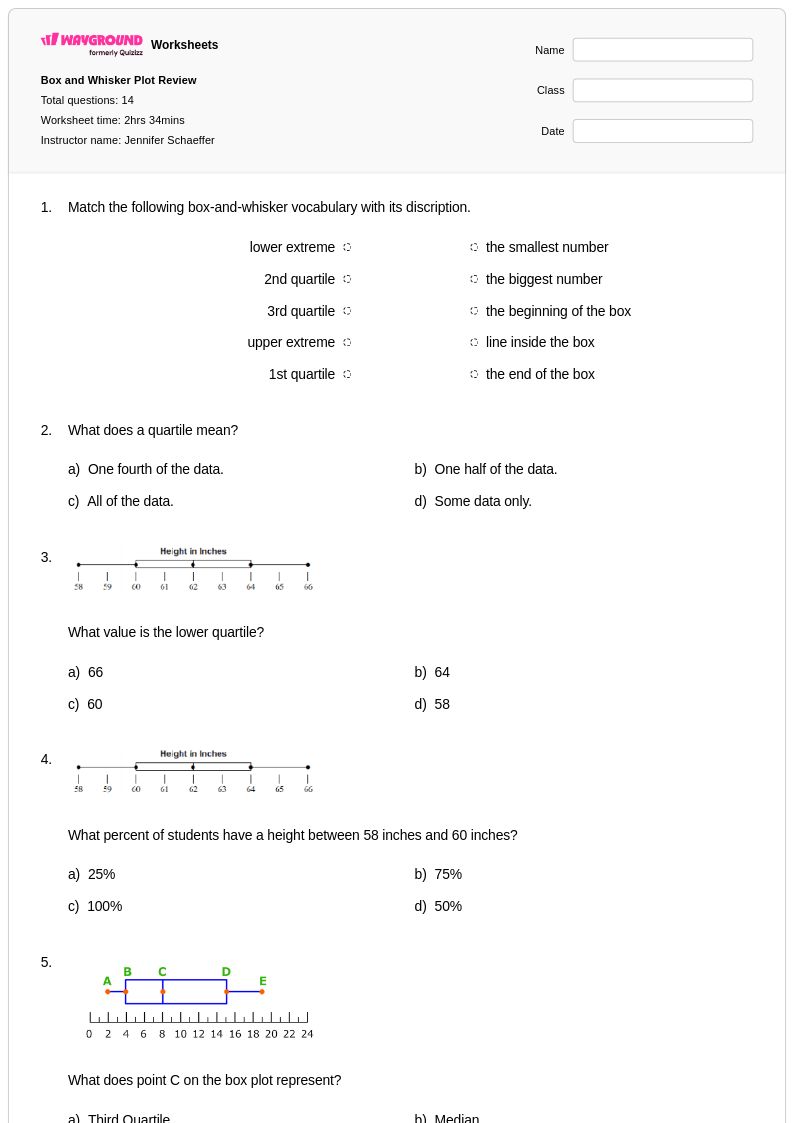
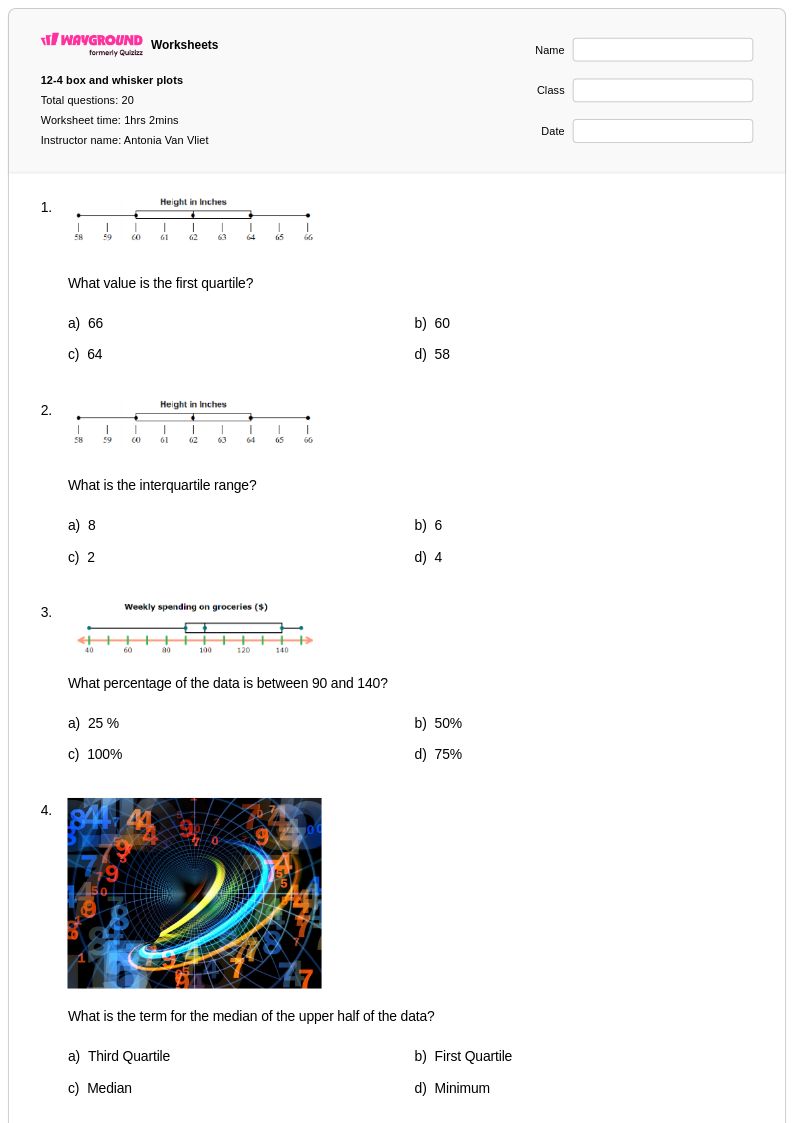
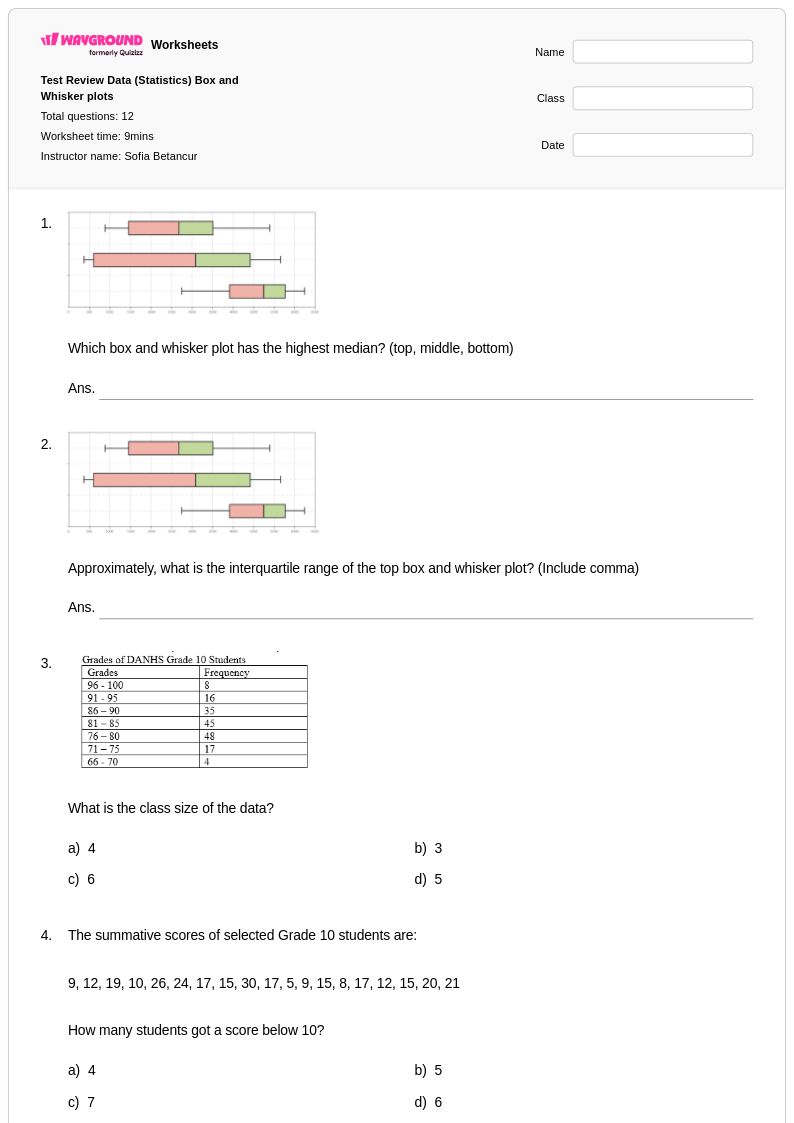
Box and whisker plot worksheets available through Wayground (formerly Quizizz) provide comprehensive practice for students learning to analyze and interpret data distributions using this essential statistical visualization tool. These mathematics worksheets strengthen critical skills including identifying quartiles, calculating interquartile range, recognizing outliers, and comparing multiple data sets through visual analysis. Students develop proficiency in constructing box plots from raw data, reading existing plots to determine median values and data spread, and making informed conclusions about data variability and central tendency. The practice problems progress systematically from basic plot reading exercises to complex multi-step analyses, with complete answer keys supporting both independent study and classroom instruction. These free printables offer extensive opportunities for students to master the foundational concepts of data representation that are crucial for advanced statistical reasoning.
Wayground (formerly Quizizz) empowers educators with millions of teacher-created box and whisker plot resources that streamline lesson planning and accommodate diverse learning needs in probability and statistics instruction. The platform's robust search and filtering capabilities allow teachers to quickly locate worksheets aligned with specific curriculum standards and learning objectives, while differentiation tools enable seamless customization for varying skill levels within the classroom. These comprehensive worksheet collections are available in both printable pdf format and interactive digital versions, providing flexibility for traditional paper-based practice sessions or technology-enhanced learning environments. Teachers utilize these resources for targeted skill practice, remediation support for struggling learners, and enrichment activities for advanced students, ensuring that every learner develops confidence in interpreting statistical data through box and whisker plot analysis.