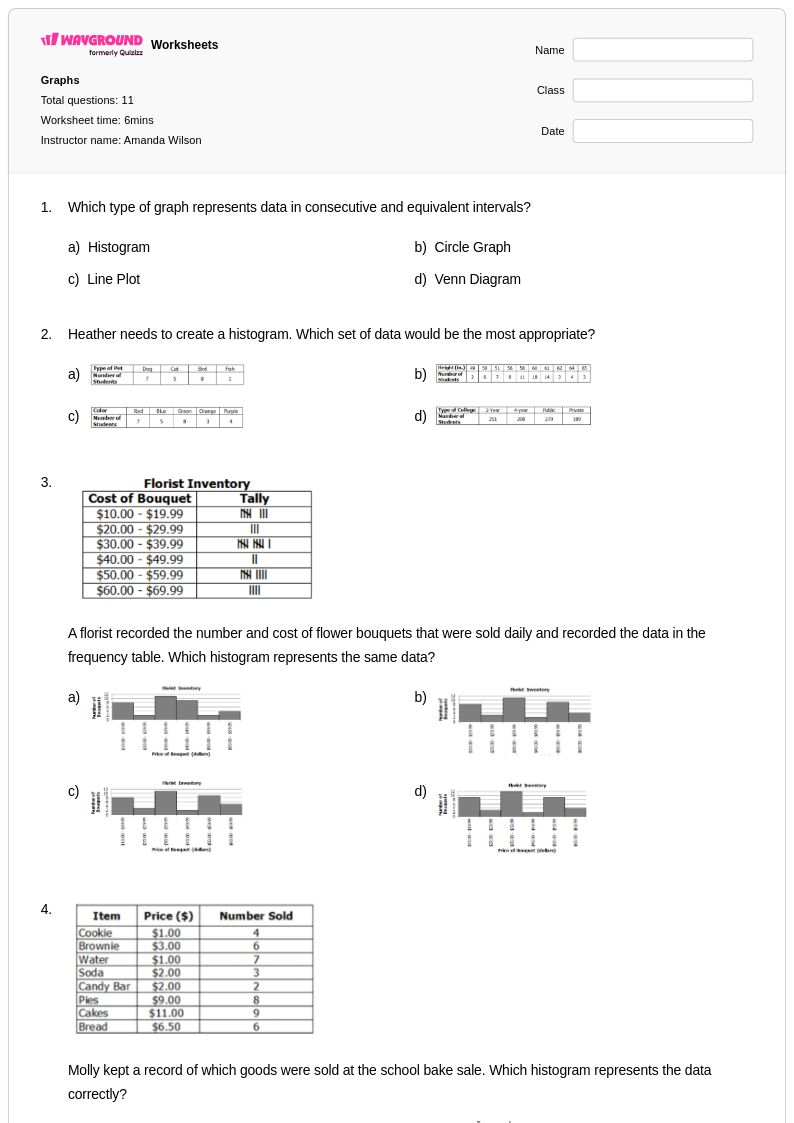
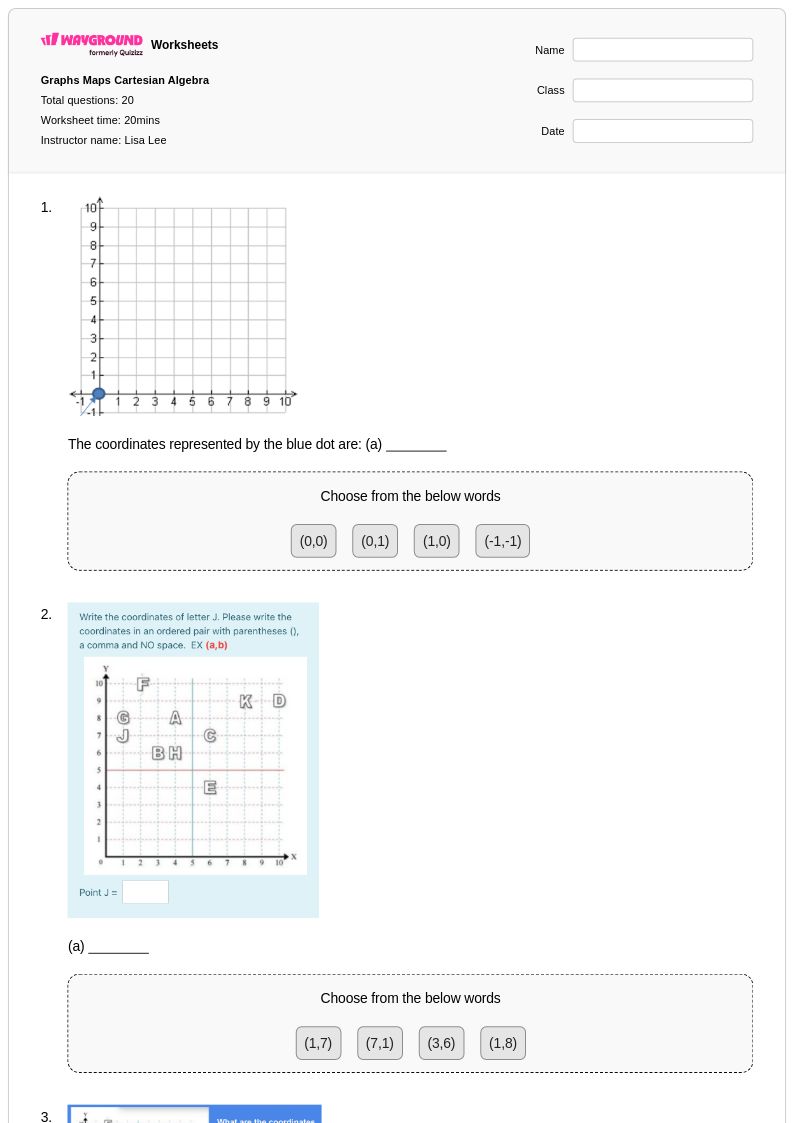
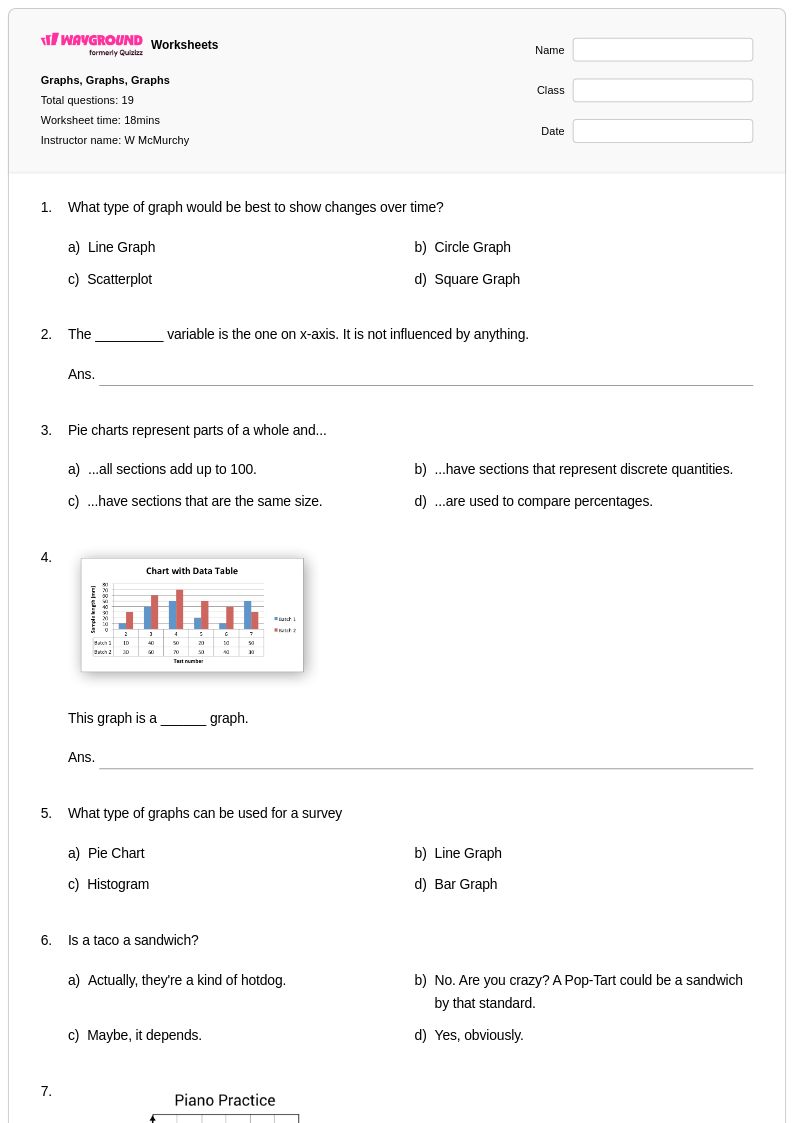
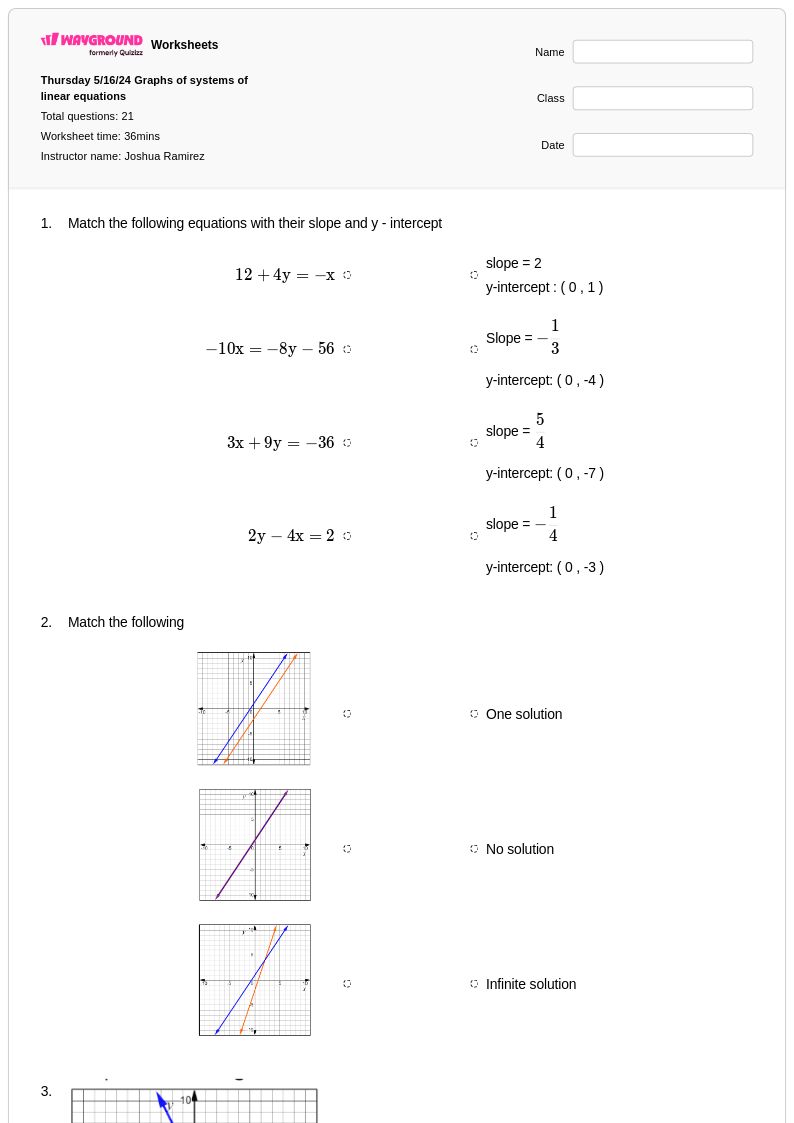
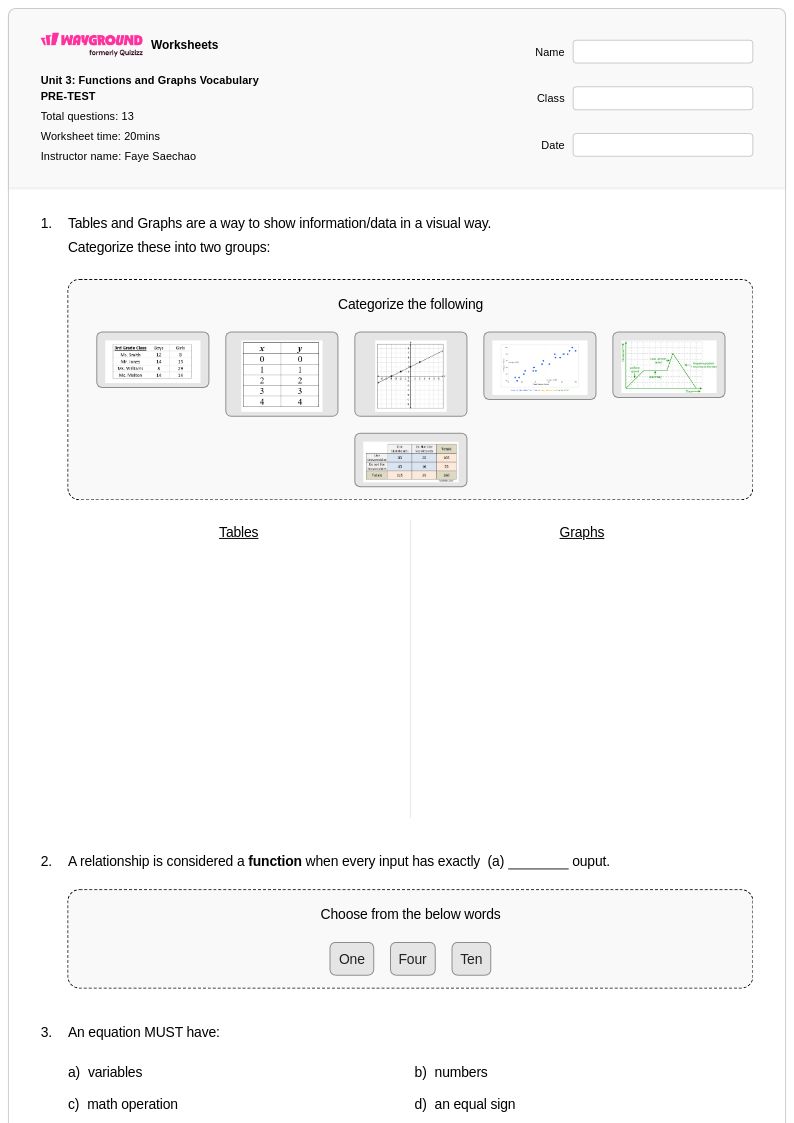
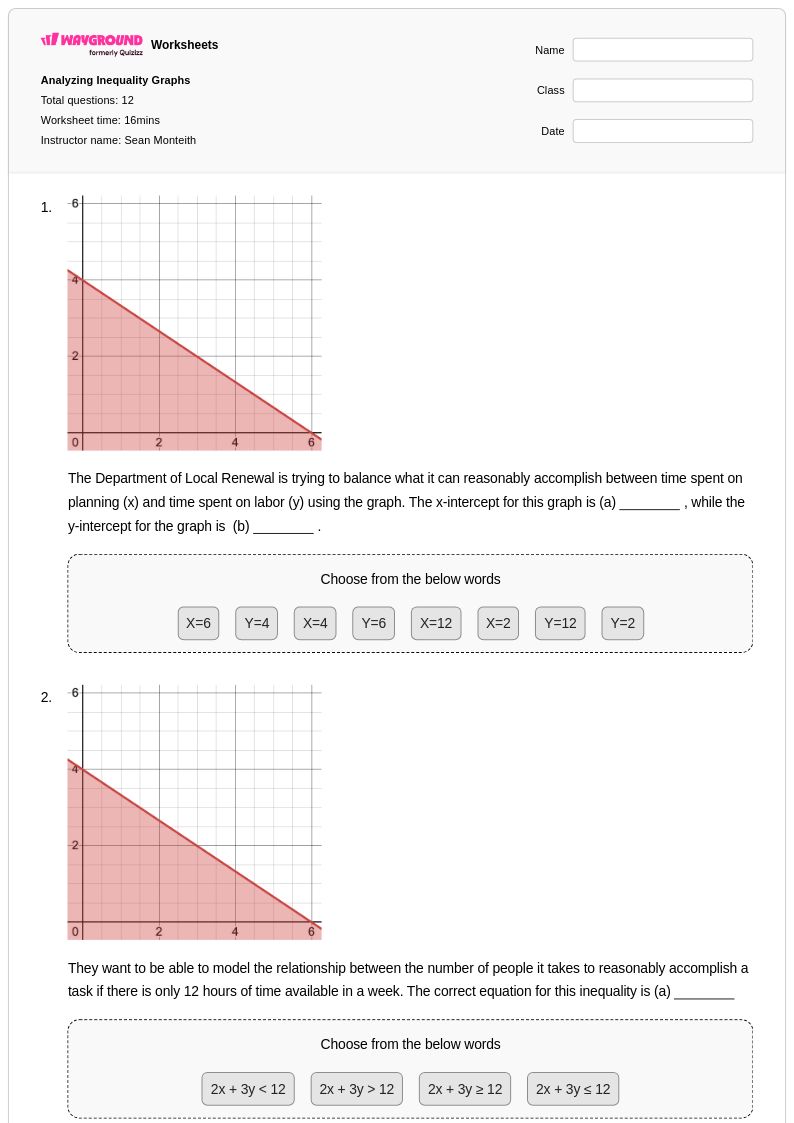
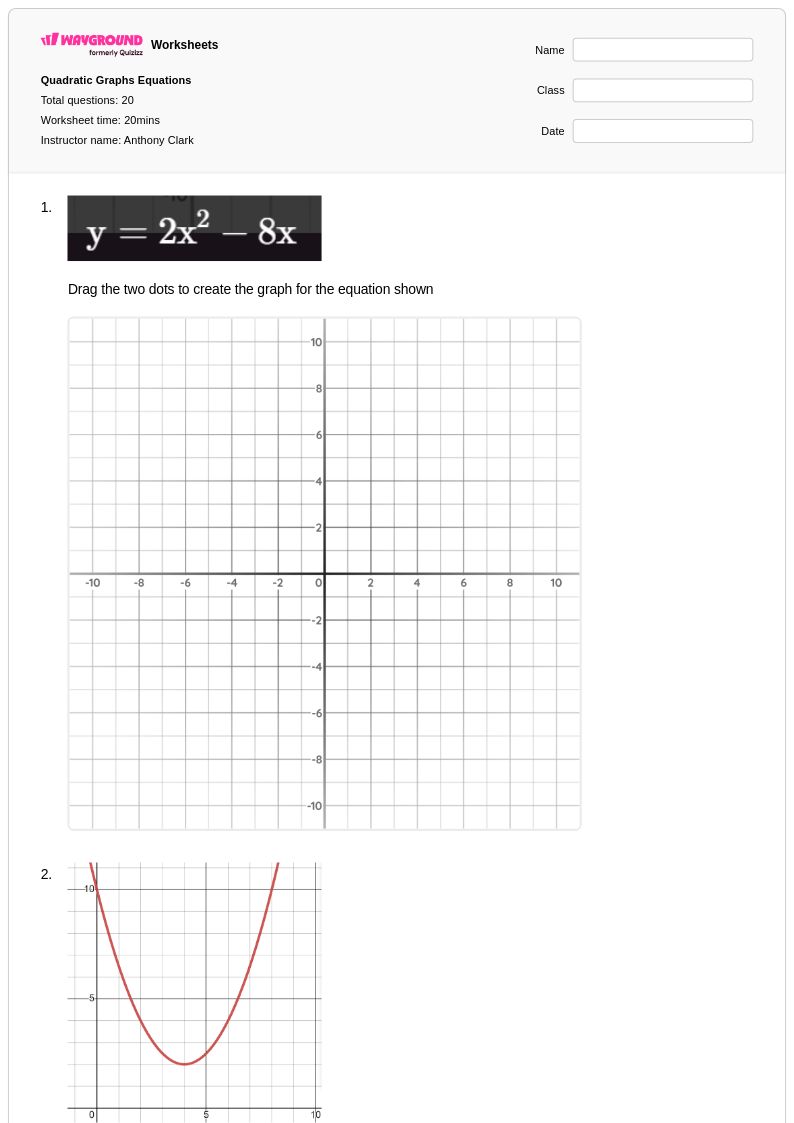
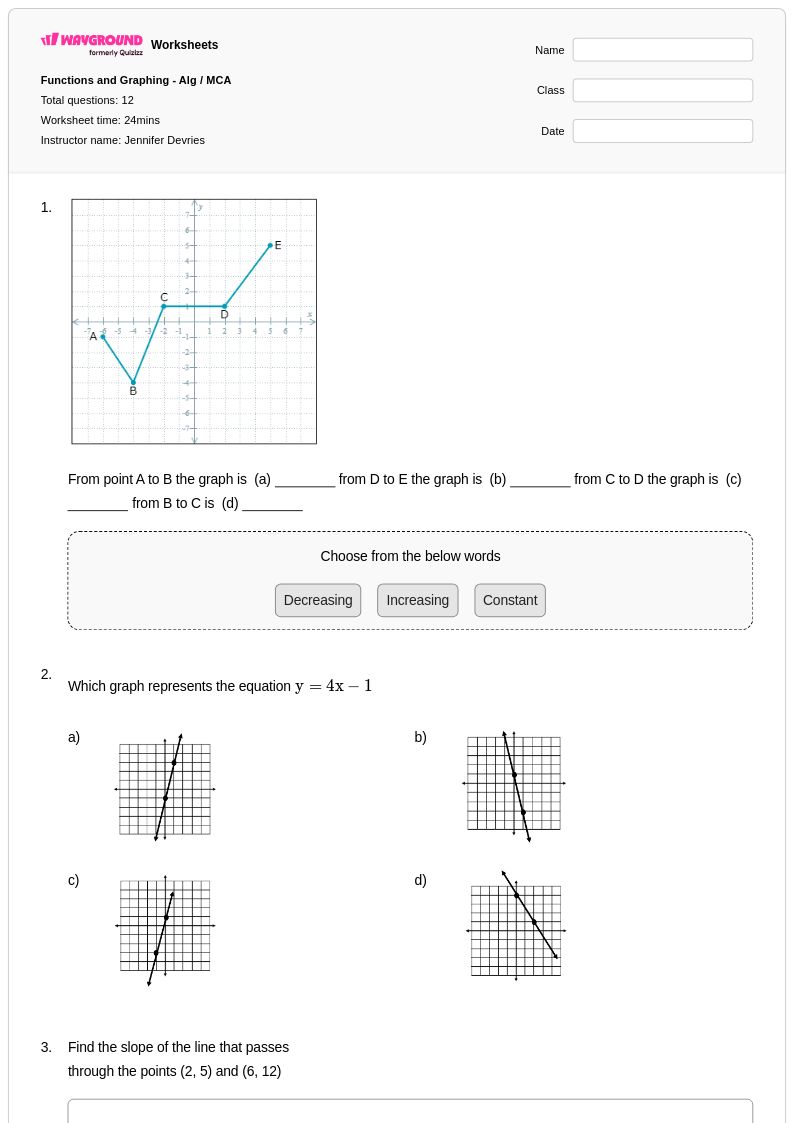
Enhance student understanding of density graphs with Wayground's comprehensive collection of free worksheets and printables, featuring practice problems and answer keys to master data visualization and statistical distribution concepts.
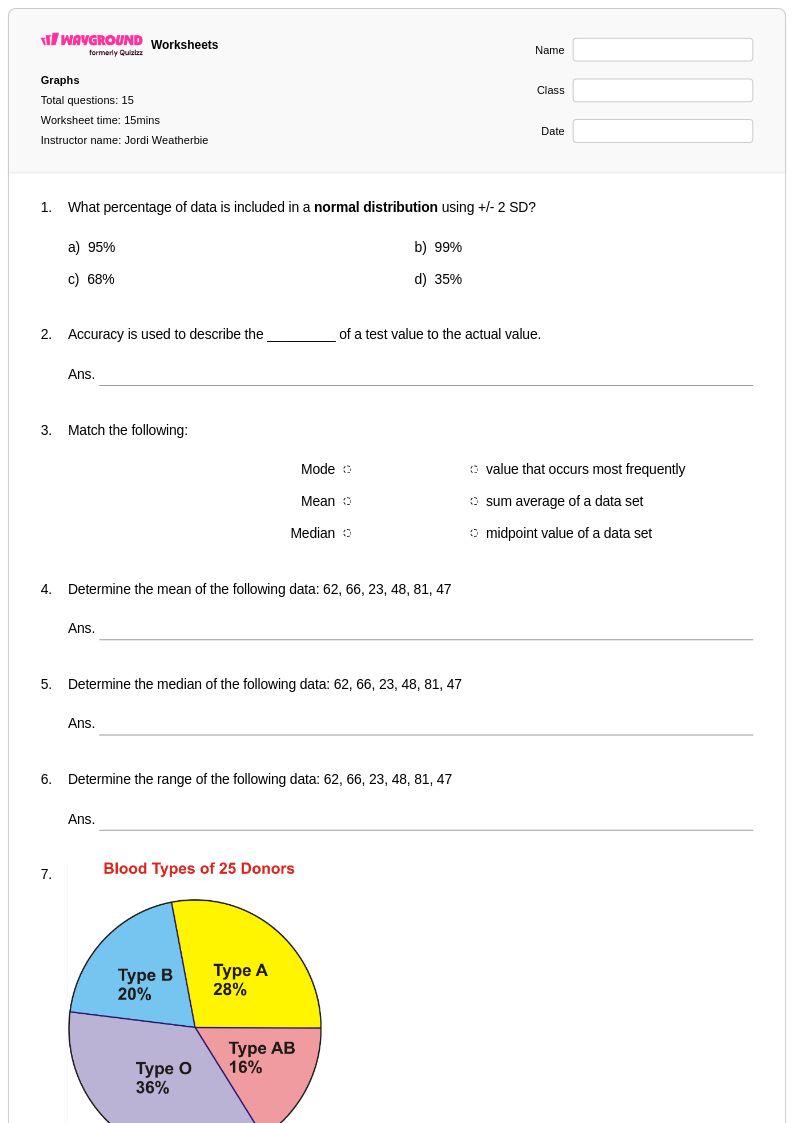
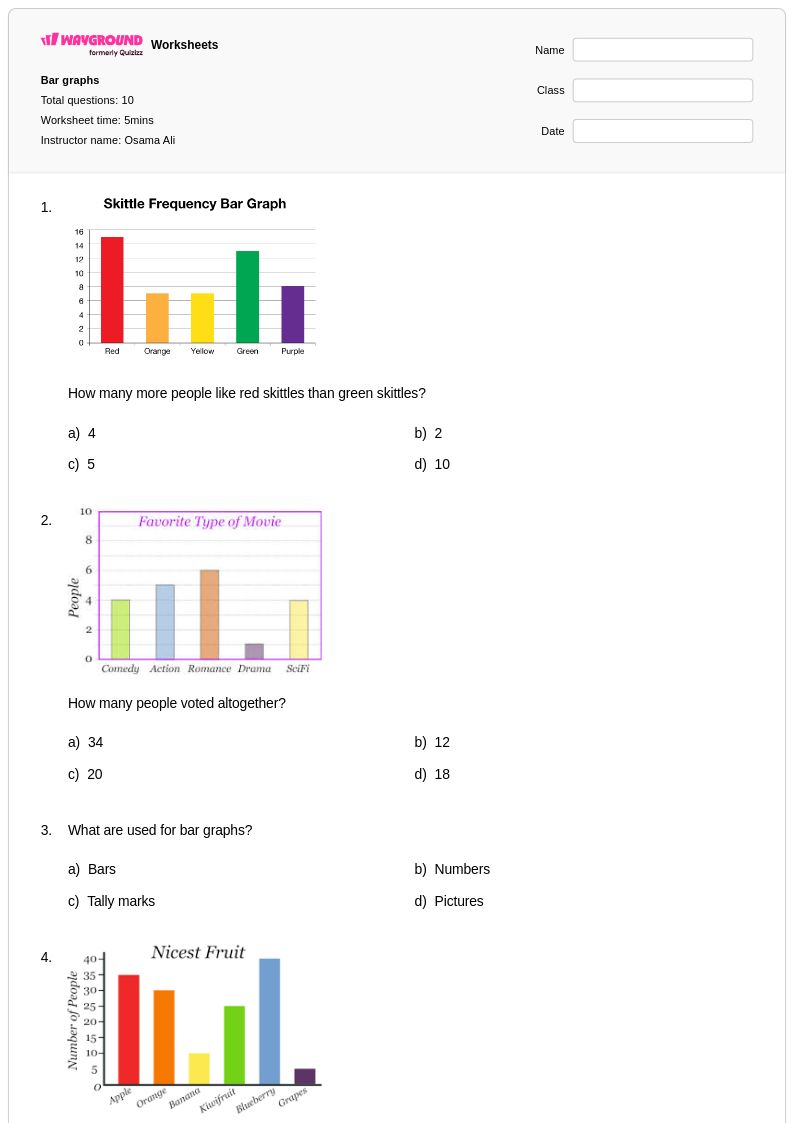
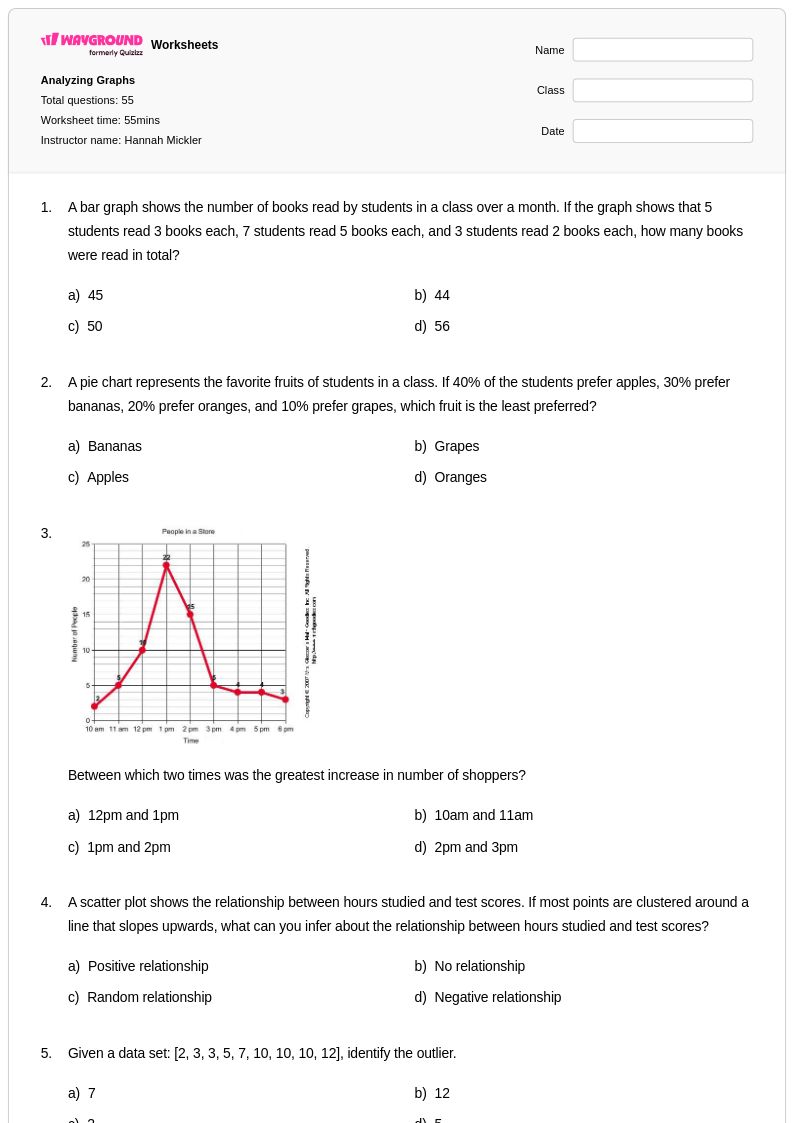
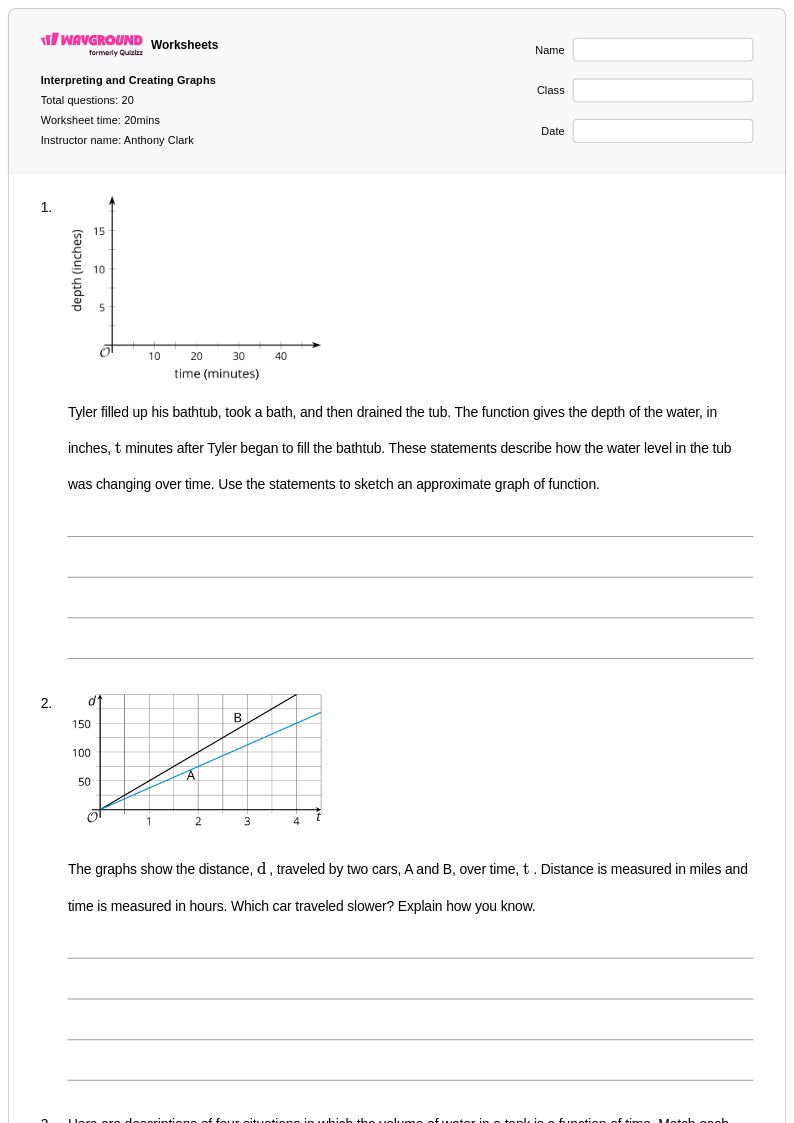
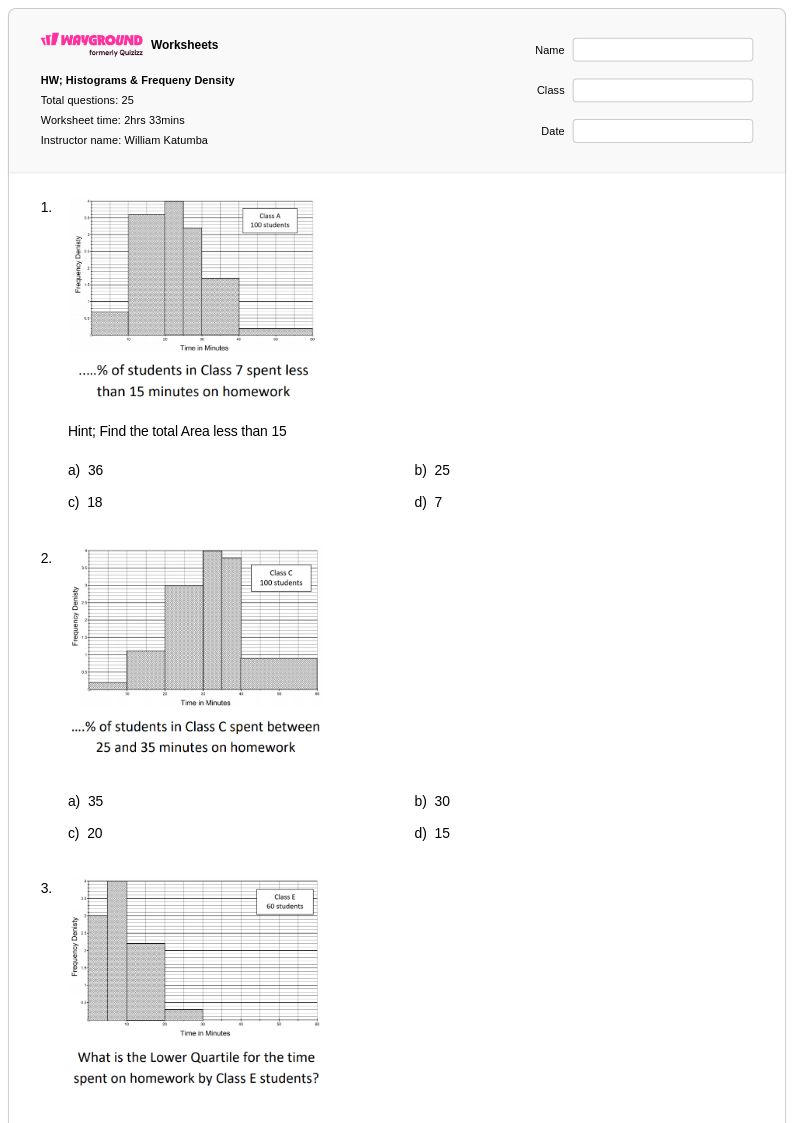
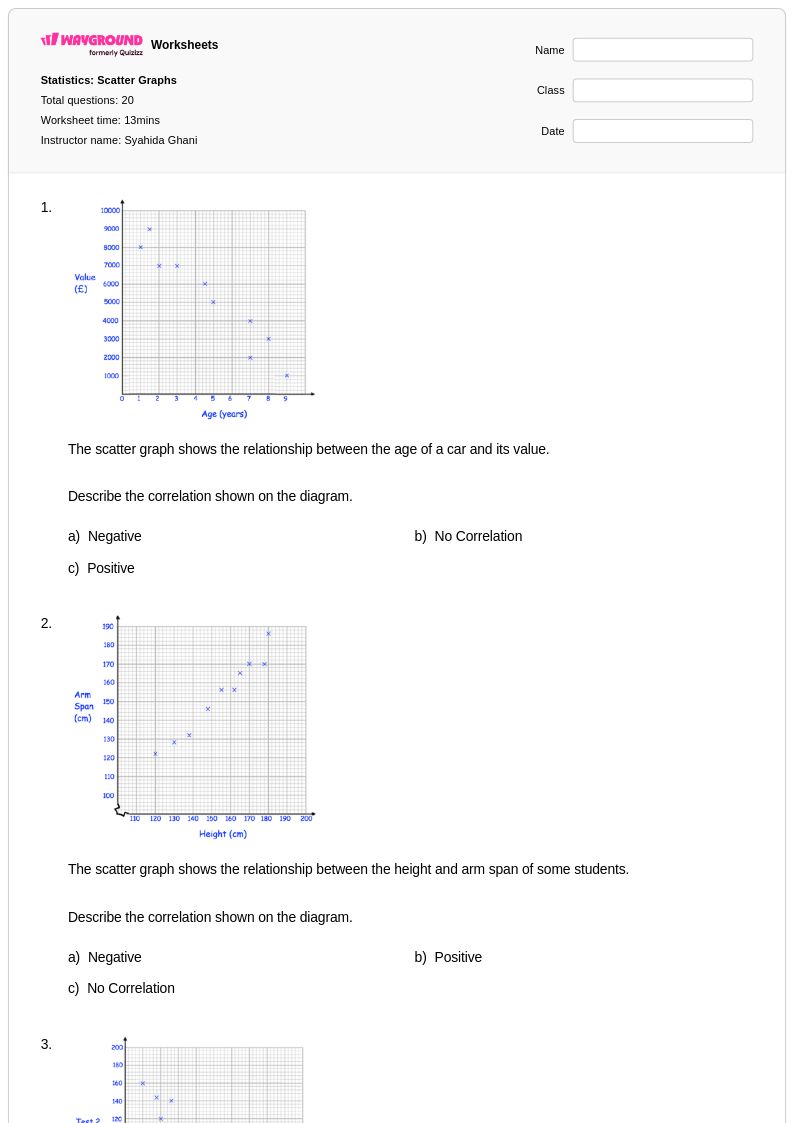
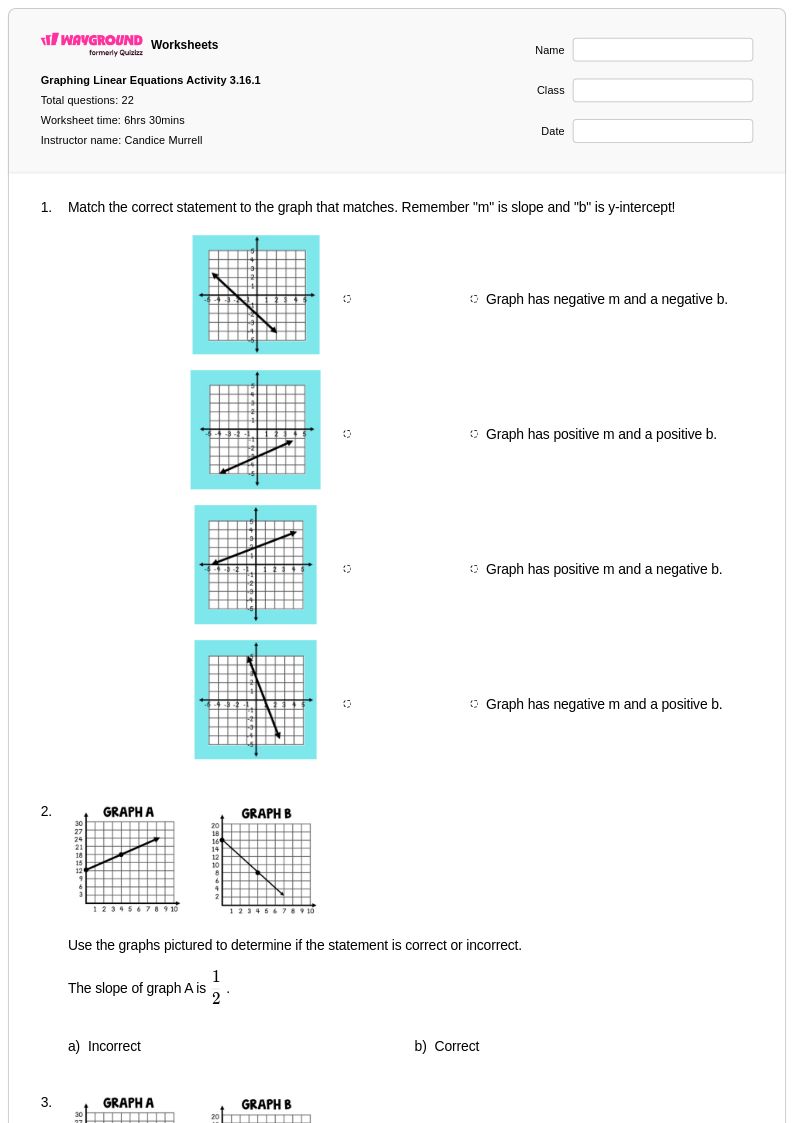
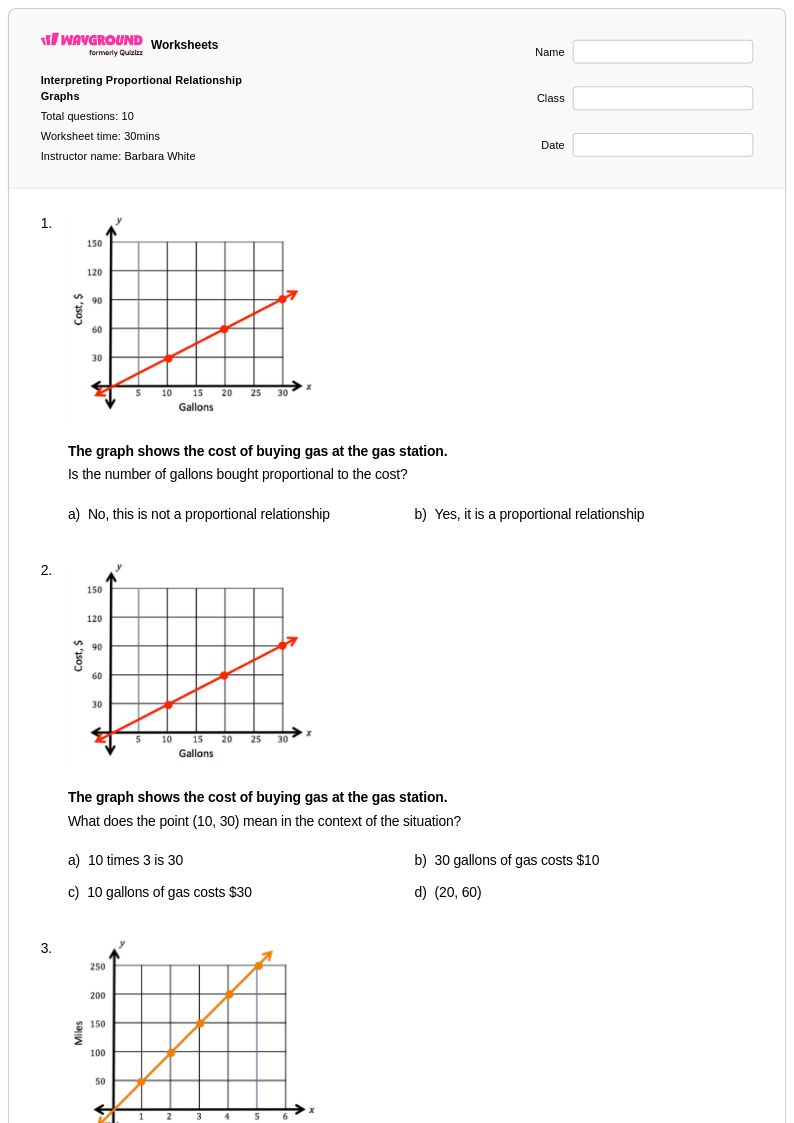
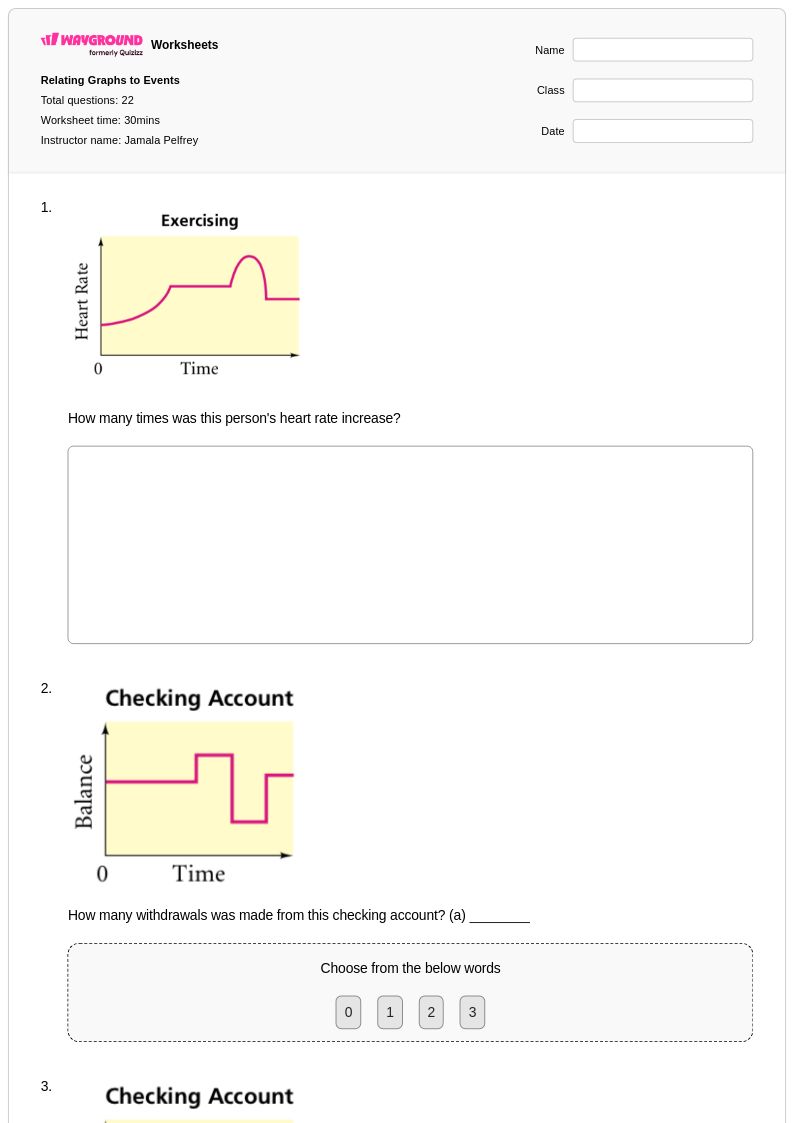
Density graphs worksheets from Wayground (formerly Quizizz) provide comprehensive practice materials that help students master the interpretation and analysis of probability distributions through visual representations. These carefully crafted worksheets focus on developing critical skills in reading density curves, understanding the relationship between area under curves and probability, and connecting theoretical distributions to real-world scenarios. Students work through practice problems that cover normal distributions, uniform distributions, and other continuous probability models, strengthening their ability to calculate probabilities using density functions and interpret statistical data presented in graphical form. Each worksheet comes with a complete answer key and is available as a free printable pdf, making it easy for educators to incorporate these essential statistical concepts into their mathematics curriculum.
Wayground (formerly Quizizz) supports mathematics teachers with an extensive collection of millions of teacher-created density graph resources that can be easily accessed through powerful search and filtering tools. These worksheets align with statistical standards and offer flexible customization options that allow educators to differentiate instruction based on student needs and learning objectives. Teachers can seamlessly integrate these materials into their lesson planning for initial concept introduction, targeted remediation for struggling learners, or enrichment activities for advanced students. The platform's dual format availability ensures that these density graph worksheets work equally well for traditional classroom instruction as printable pdf handouts or as interactive digital assignments, providing the versatility needed to support diverse teaching environments and student learning preferences while building essential probability and statistics skills.
FAQs
How do I teach density graphs and probability density functions?
Start with the core idea that area equals probability, students who grasp this early find the rest of the topic much more manageable. Use a uniform distribution first because the area calculation is just length × height, which makes the concept concrete before you introduce the normal curve. Once students can shade a region and calculate its area, move to interpreting what that area means in context: 'there's a 30% chance a randomly selected value falls in this range.' Connecting the graph to a real scenario, wait times, test scores, heights, keeps the abstraction grounded.
What exercises help students practice reading and interpreting density graphs?
The most effective practice moves from reading to calculating to interpreting. Start with exercises where students shade a described region on a given curve, then calculate the probability that region represents. Follow with problems that reverse the process: given a probability, identify the corresponding region. Wayground's density graph worksheets cover normal distributions, uniform distributions, and other continuous models, so students encounter varied curve shapes rather than drilling one type repeatedly.
What mistakes do students commonly make with density graphs?
Three errors come up constantly. First, students treat the y-axis value (the density) as a probability — they'll read off f(x) = 0.4 and say 'the probability is 40%,' ignoring that probability only comes from area. Second, they assume every density curve is a normal distribution and apply the 68-95-99.7 rule where it doesn't apply. Third, when comparing two distributions, they focus on the peak height rather than the spread, missing that a taller, narrower curve and a shorter, wider curve can represent the same total probability.
How do I use Wayground's density graph worksheets in my class?
You can run these as a digital quiz hosted on Wayground — students work through problems on their devices and results come back to you immediately. If you'd rather go paper, download the printable PDF and distribute it in class; every worksheet includes a complete answer key so students can self-check or you can review answers together. For grading paper submissions, the Wayground for Teachers app lets you scan or capture student work directly.
How do density graphs fit into the high school statistics curriculum?
In the Common Core progression, density graphs sit at the intersection of two threads: summarizing distributions (which students begin with dot plots and histograms in middle school) and understanding probability as a long-run frequency. By high school, students are expected to move from discrete distributions to continuous ones, which is exactly where density curves come in. Density graphs build directly on students' earlier work with histograms, the conceptual shift is from bar height representing count or relative frequency to curve height representing density, and they lay the groundwork for using the normal distribution to make probability estimates and, later, to reason about sampling distributions.
How can I differentiate density graph practice for students at different levels?
For students who struggle with the abstract notation, Wayground's Read Aloud accommodation reads question text aloud, which helps when the barrier is language processing rather than statistical understanding. Reducing answer choices is useful for students who get overwhelmed by similar-looking options on multiple-choice probability questions. For layout-based accessibility, you can generate an alternate version of the same worksheet with larger font or a dyslexia-friendly font without creating a separate assignment — the content stays identical, just the presentation changes.