Free Printable Heating Curve Worksheets for Grade 9
Grade 9 heating curve worksheets from Wayground provide comprehensive printables and practice problems with answer keys to help students master phase transitions, temperature changes, and energy relationships in chemistry through engaging PDF exercises.
Explore printable Heating Curve worksheets for Grade 9
Heating curve worksheets for Grade 9 students available through Wayground (formerly Quizizz) provide comprehensive practice with one of chemistry's most fundamental concepts. These educational resources help students master the relationship between temperature and phase changes as matter transitions between solid, liquid, and gas states. Students work through practice problems that require them to interpret graphs showing temperature versus time, identify plateau regions where phase changes occur, and calculate energy requirements for melting, vaporization, and other phase transitions. The worksheets include detailed answer keys that enable independent study and self-assessment, while printable pdf formats ensure accessibility both in classroom settings and for homework assignments. These free resources strengthen critical thinking skills as students analyze why temperature remains constant during phase changes despite continued heating, connecting molecular-level understanding to macroscopic observations.
Wayground (formerly Quizizz) supports educators with an extensive collection of heating curve worksheets created by millions of teachers worldwide, offering unparalleled variety and quality for Grade 9 chemistry instruction. The platform's robust search and filtering capabilities allow teachers to quickly locate resources that align with specific curriculum standards and match their students' skill levels. Differentiation tools enable customization of worksheet difficulty, while flexible formatting options provide both digital and printable pdf versions to accommodate diverse learning environments. These features streamline lesson planning by offering ready-to-use materials for introducing heating curves, providing targeted remediation for struggling students, and creating enrichment opportunities for advanced learners. Teachers can efficiently select from thousands of practice problems that range from basic graph interpretation to complex calculations involving specific heat capacity and latent heat, ensuring comprehensive skill development across all learning objectives related to phase change thermodynamics.
FAQs
How do I teach heating curves to chemistry students?
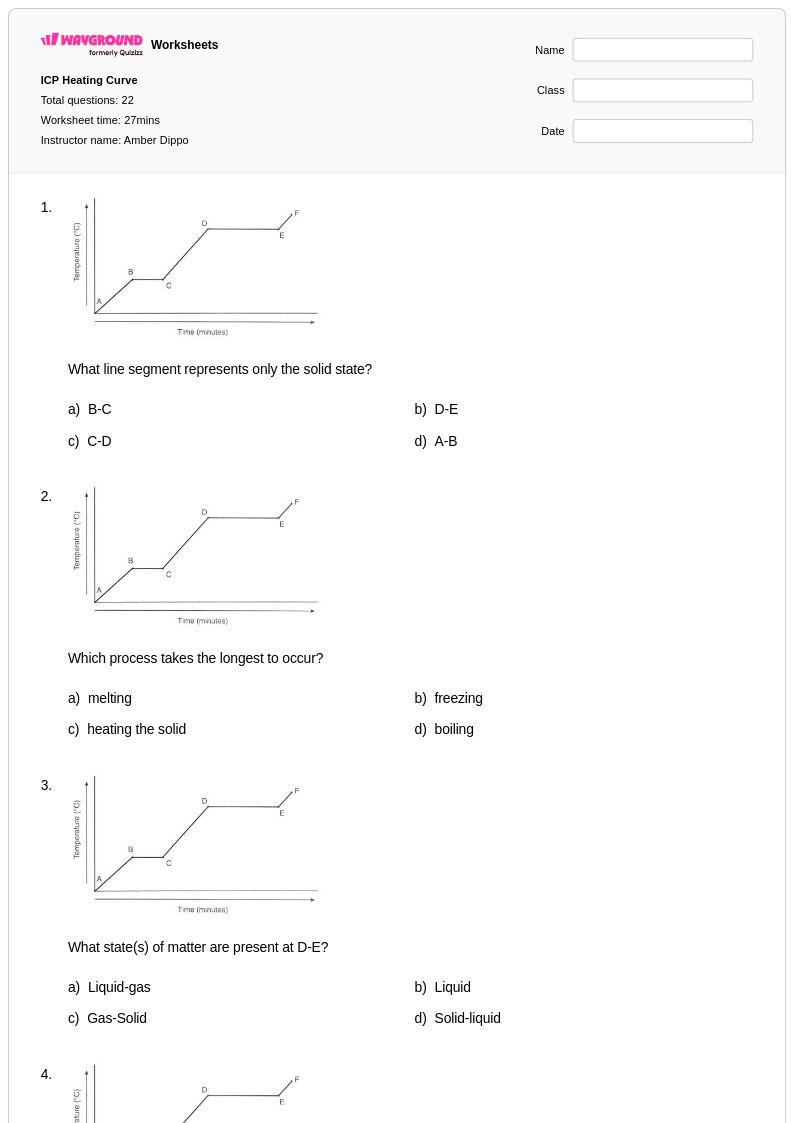
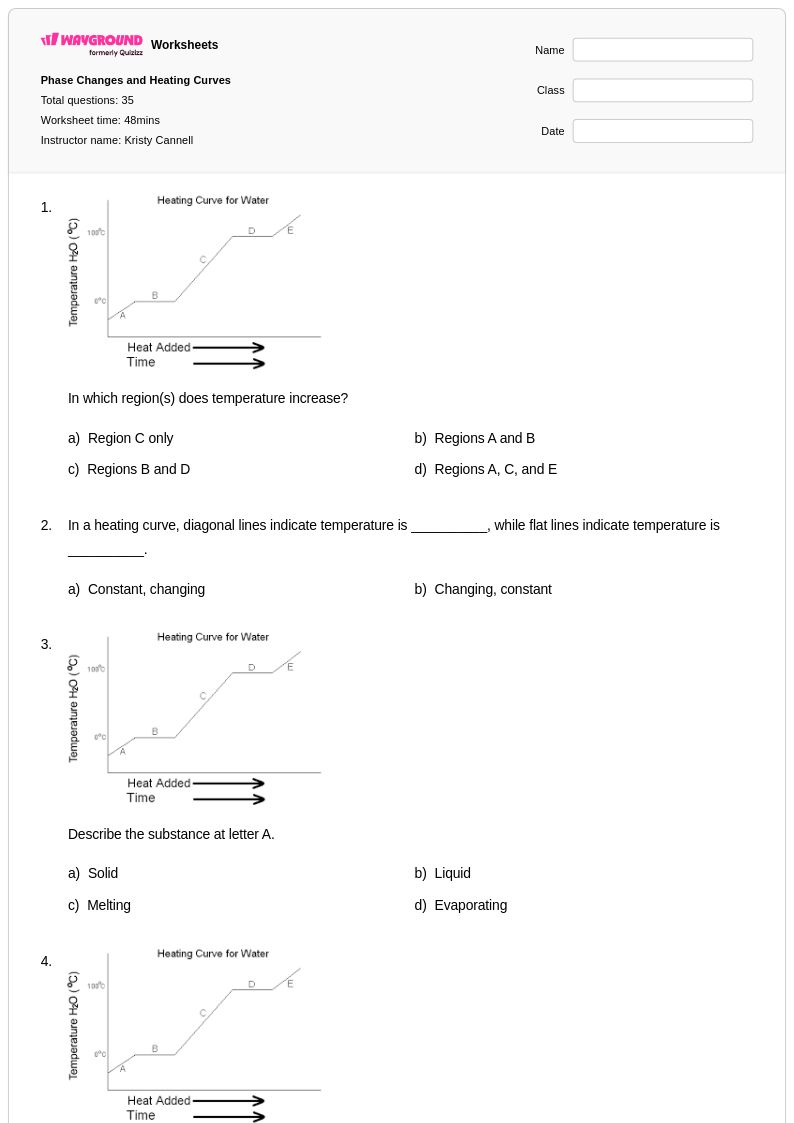
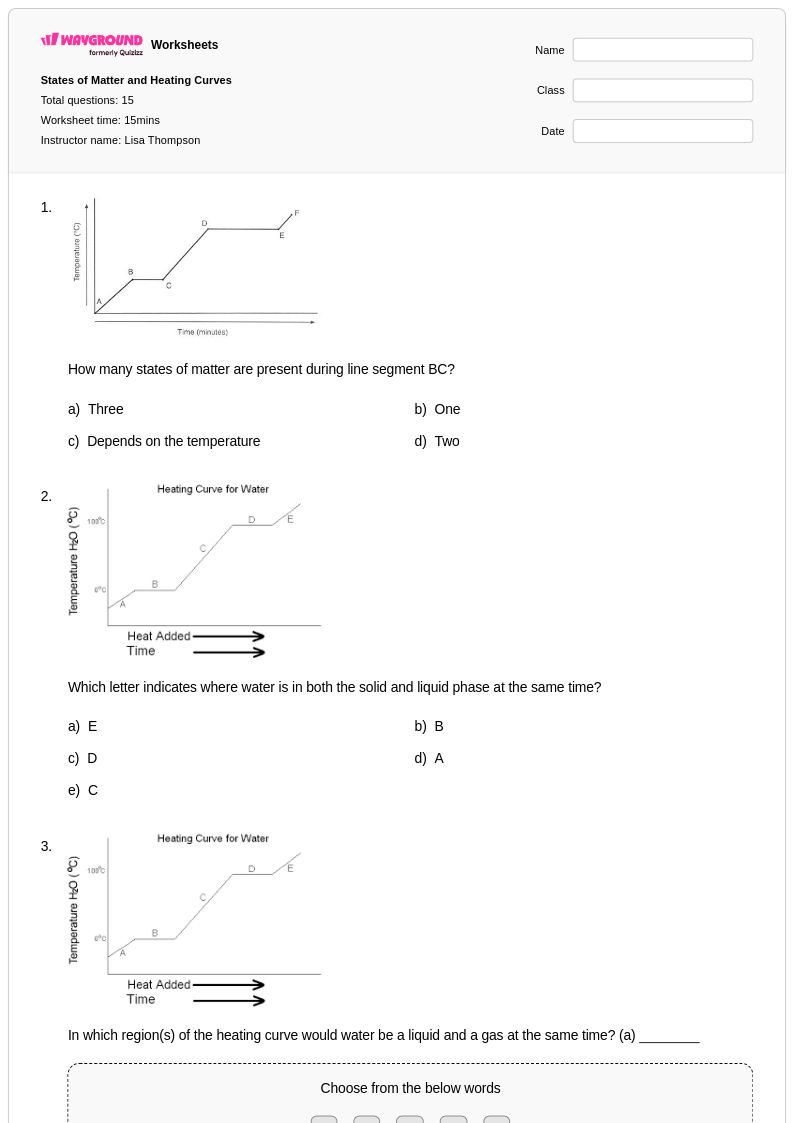
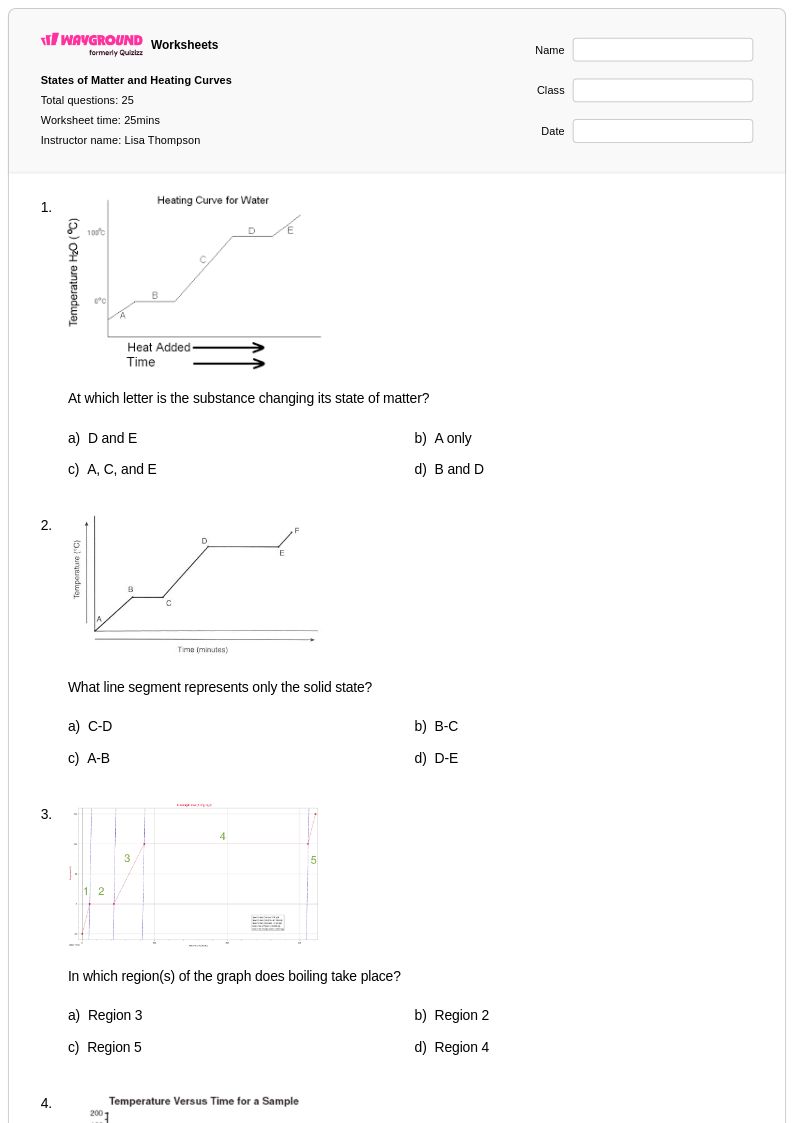
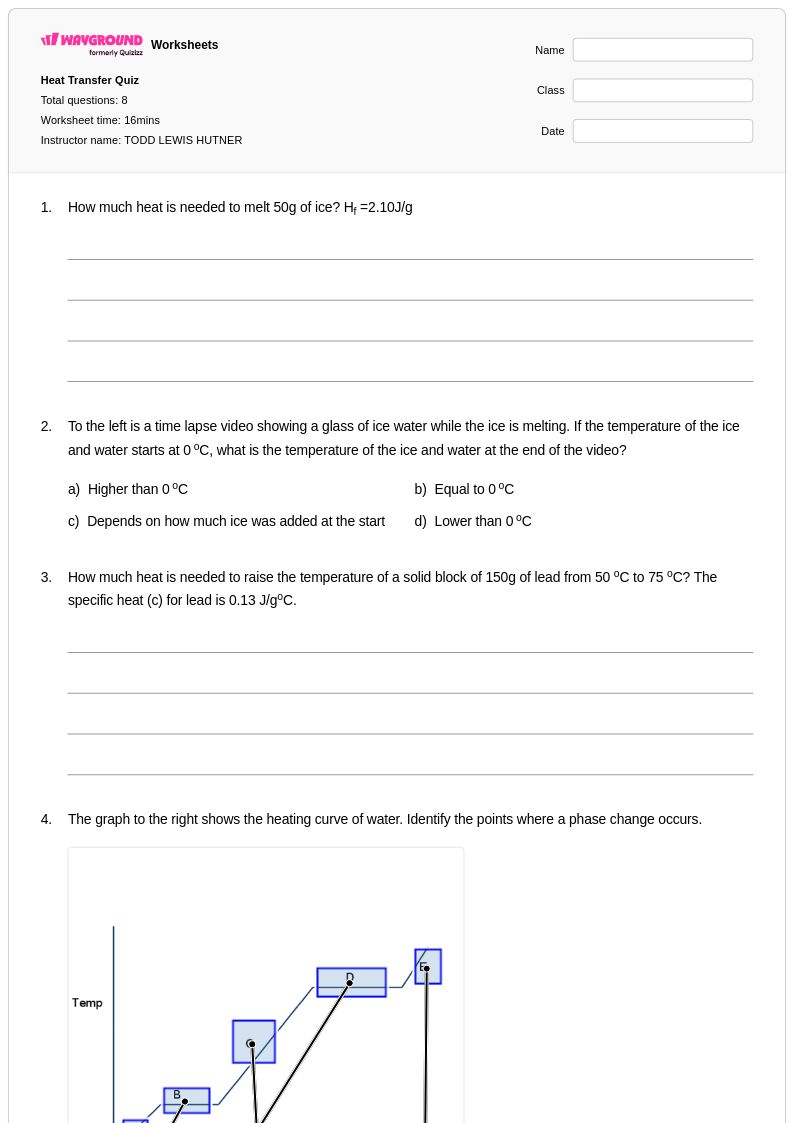
Start by grounding students in the concept that temperature does not change during a phase transition — energy is instead absorbed or released to break or form intermolecular bonds. Use a labeled heating curve diagram to walk through each segment: solid warming, melting plateau, liquid warming, boiling plateau, and gas warming. Connecting each region to molecular behavior (kinetic energy vs. potential energy) helps students build conceptual understanding before tackling calculations involving specific heat and latent heat.
What are common mistakes students make when interpreting heating curves?
The most persistent misconception is that a flat plateau on a heating curve means no energy is being added — students often confuse constant temperature with zero heat input. A second common error is conflating specific heat capacity with latent heat, leading to incorrect formula selection when calculating energy changes. Students also frequently misidentify phase transition points, especially when working with substances other than water, so explicit practice with unfamiliar substances is essential.
What practice problems help students get better at reading heating and cooling curves?
Effective practice should move from identification tasks — labeling phases and transition points on a pre-drawn curve — to calculation tasks involving q = mcΔT and q = mL. Problems that require students to sketch their own heating or cooling curve from a data table build deeper understanding because students must decide where plateaus occur and what slope values imply about specific heat. Including both familiar substances like water and unfamiliar ones prevents students from relying on memorized answers rather than genuine graph reading.
How do I help students who struggle with calculating energy changes during phase changes?
Students who struggle here often confuse which formula applies to which segment of the curve. Explicitly mapping q = mcΔT to the sloped regions and q = mL to the flat plateau regions — and having students annotate the curve with the correct formula before calculating — reduces formula-selection errors significantly. Step-by-step scaffolded problems that isolate one segment at a time before combining multi-step calculations build fluency progressively.
How can I use Wayground's heating curve worksheets in my classroom?
Wayground's heating curve worksheets are available as free printable PDFs for traditional classroom use and in digital formats for technology-integrated environments, giving teachers flexibility across different instructional settings. Teachers can also host worksheets directly as a quiz on Wayground, enabling real-time tracking of student responses. Each worksheet includes a complete answer key, making them practical for independent practice, homework assignments, or guided review sessions.
How do I differentiate heating curve instruction for students at different skill levels?
For struggling students, begin with conceptual identification tasks — labeling phases and explaining plateau behavior in words — before introducing calculations. For advanced learners, extend practice to multi-step calorimetry problems that combine heating curve analysis with Hess's Law or phase diagram interpretation. On Wayground, teachers can apply accommodations such as read aloud, reduced answer choices, and extended time to individual students, allowing the same assignment to serve the full range of learners in a single class.