
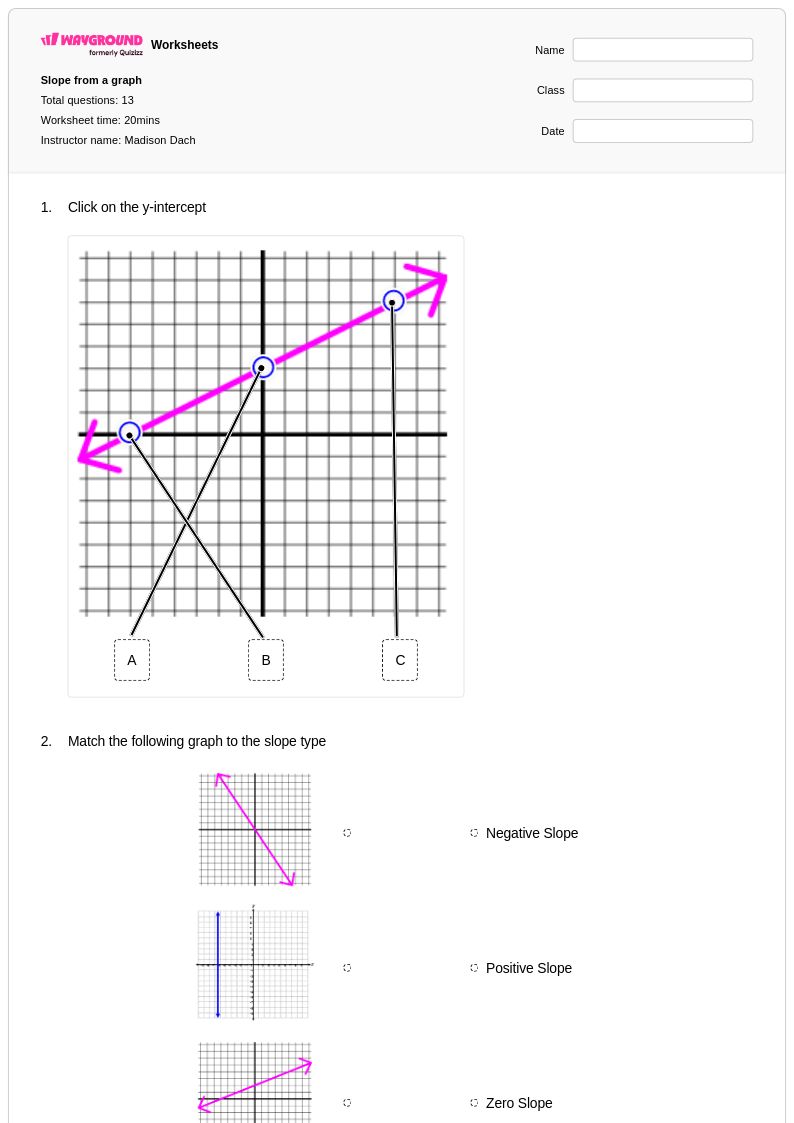
13 Q
7th
13 Q
7th
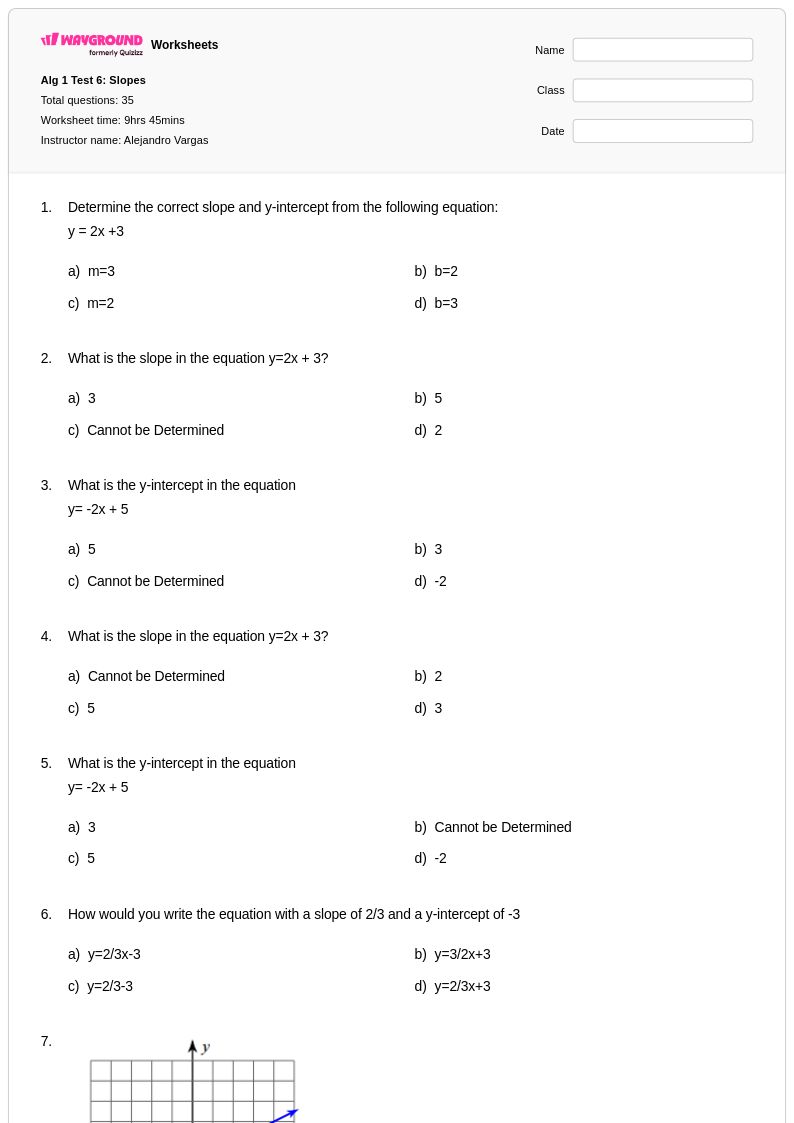
35 Q
12th
35 Q
12th
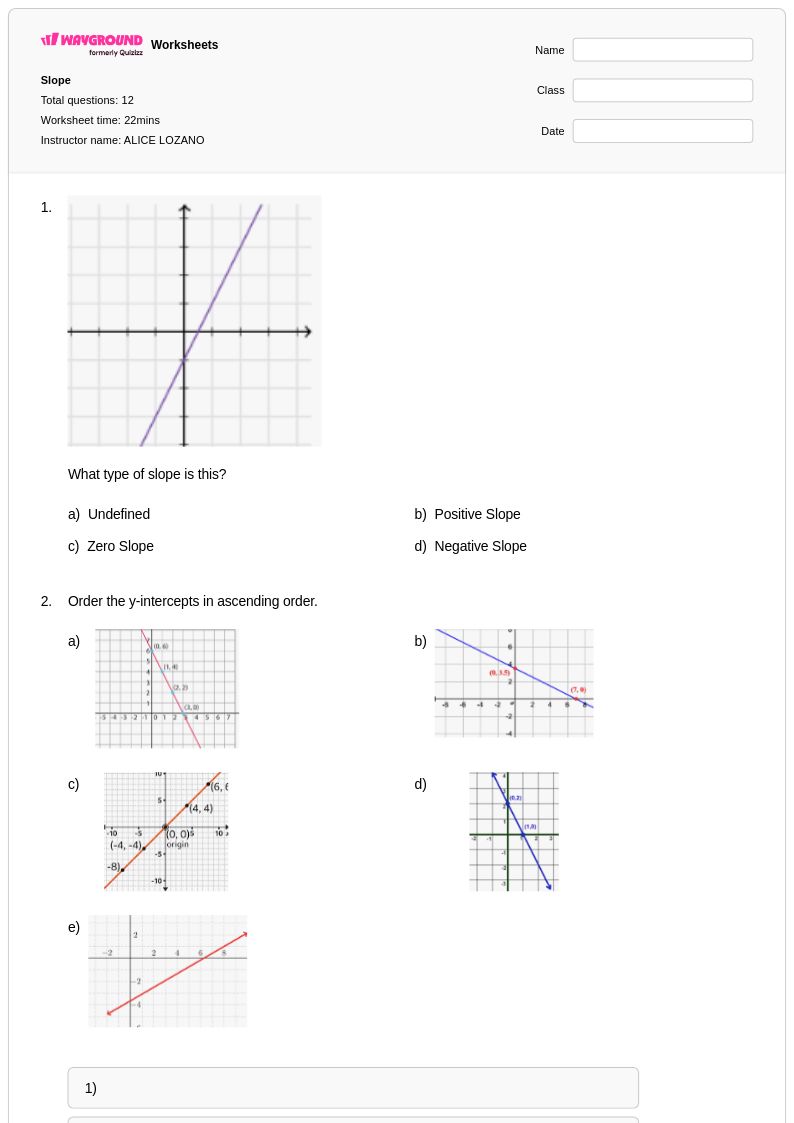
12 Q
8th
12 Q
8th
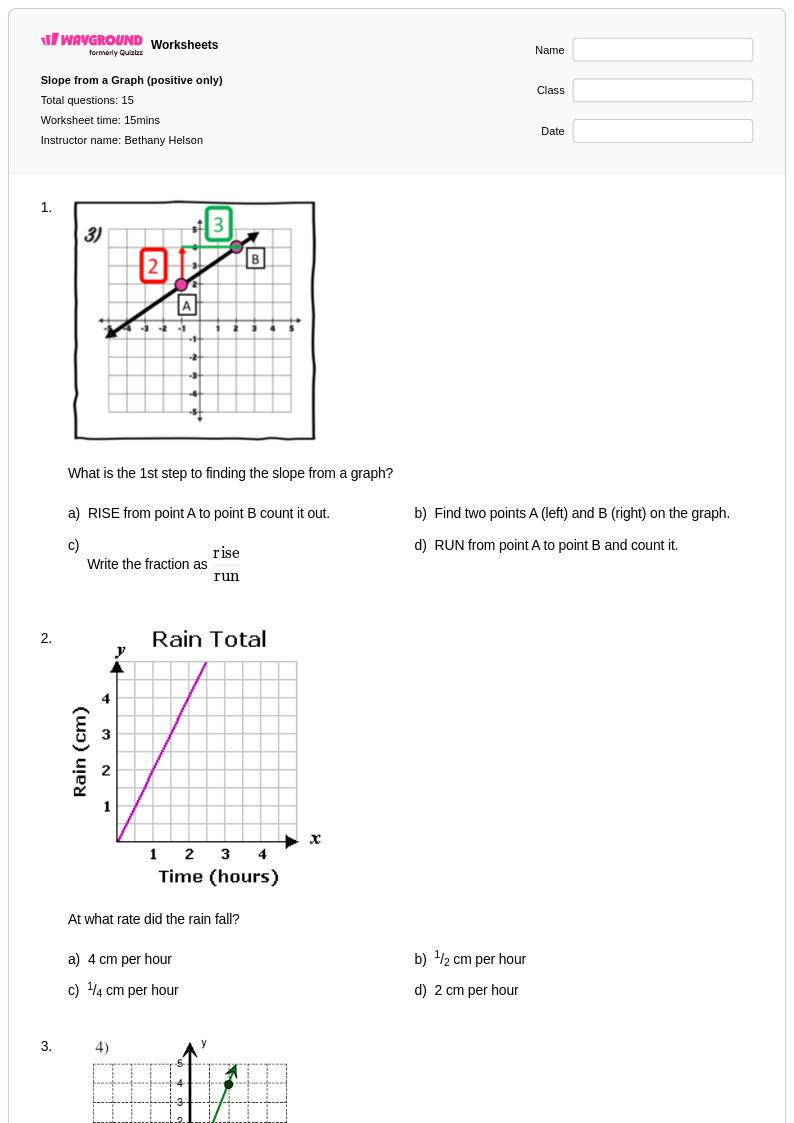
15 Q
7th
15 Q
7th
17 Q
9th
17 Q
9th

11 Q
8th
11 Q
8th
20 Q
8th - Uni
20 Q
8th - Uni
20 Q
8th - Uni
20 Q
8th - Uni
15 Q
9th - Uni
15 Q
9th - Uni

22 Q
7th
22 Q
7th
16 Q
8th - Uni
16 Q
8th - Uni
Explore Worksheets by Subjects
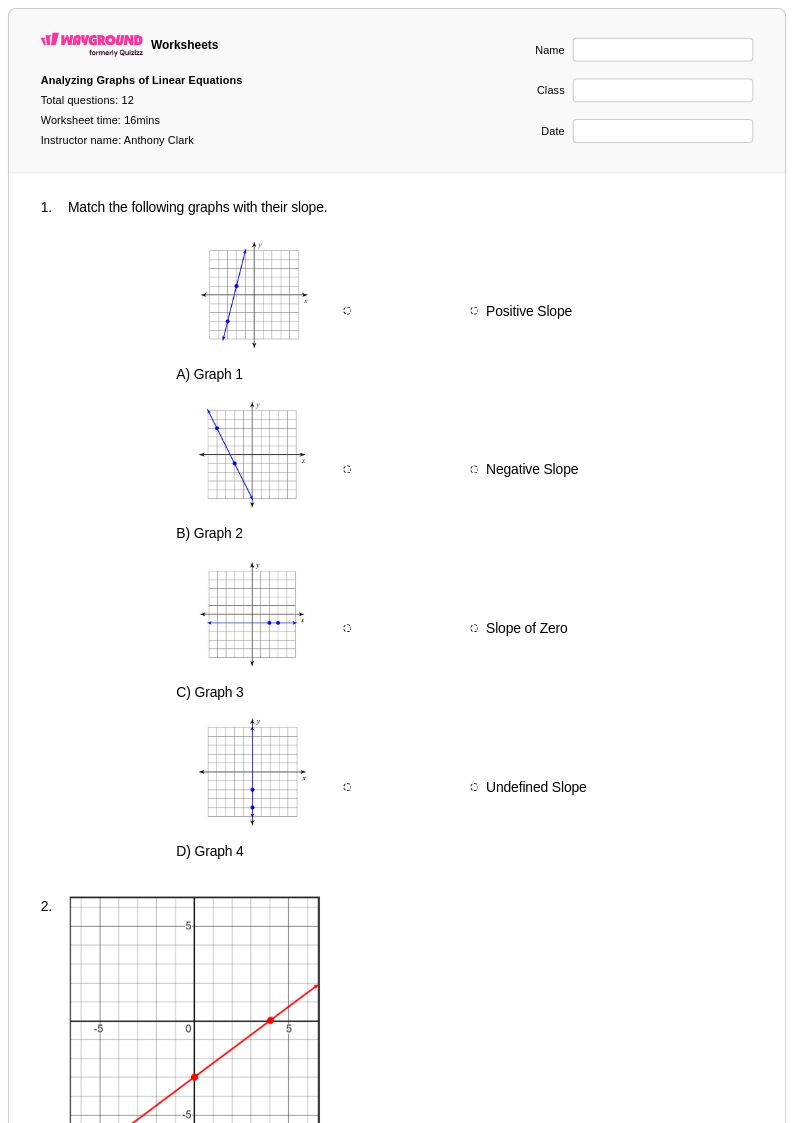
Explore printable Identifying Slope from a Graph worksheets
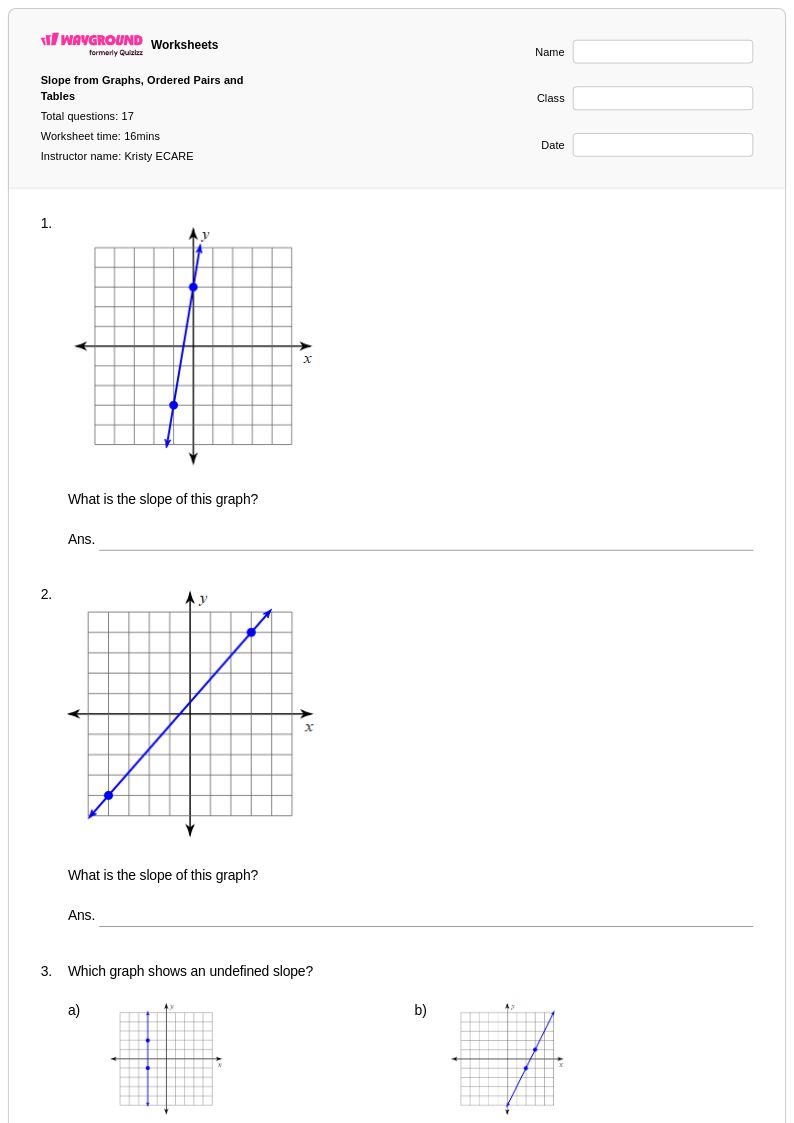
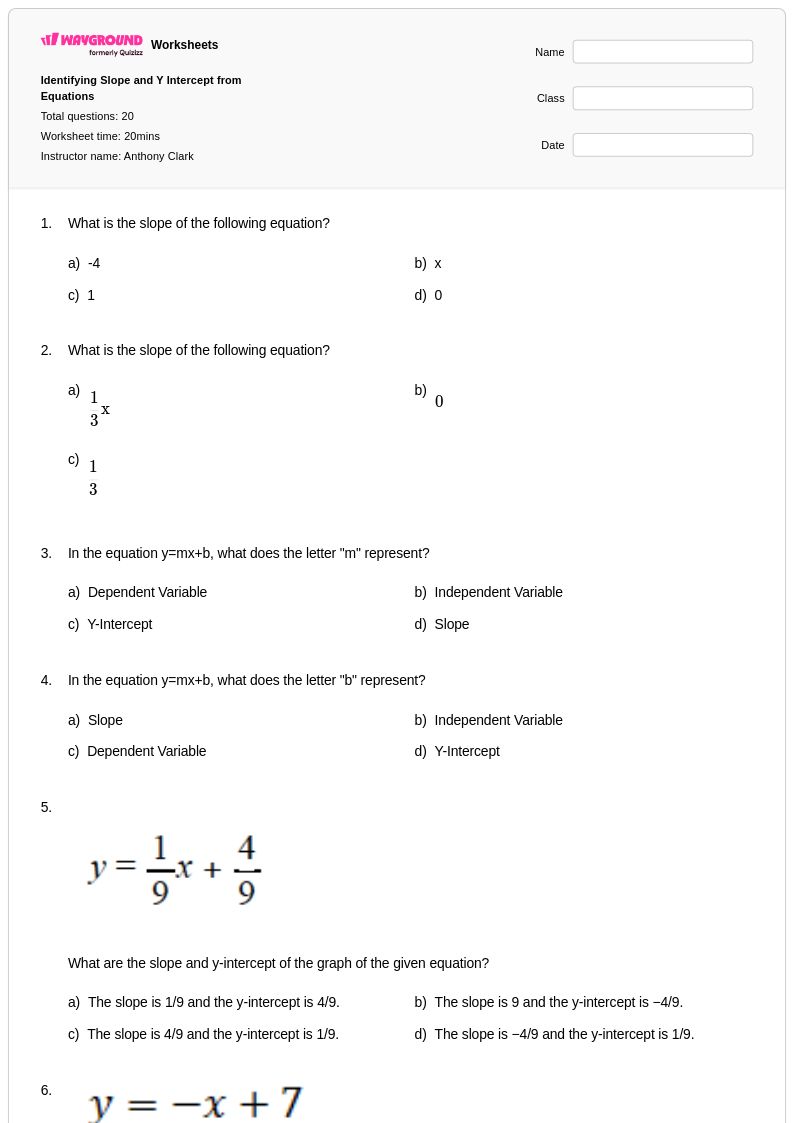
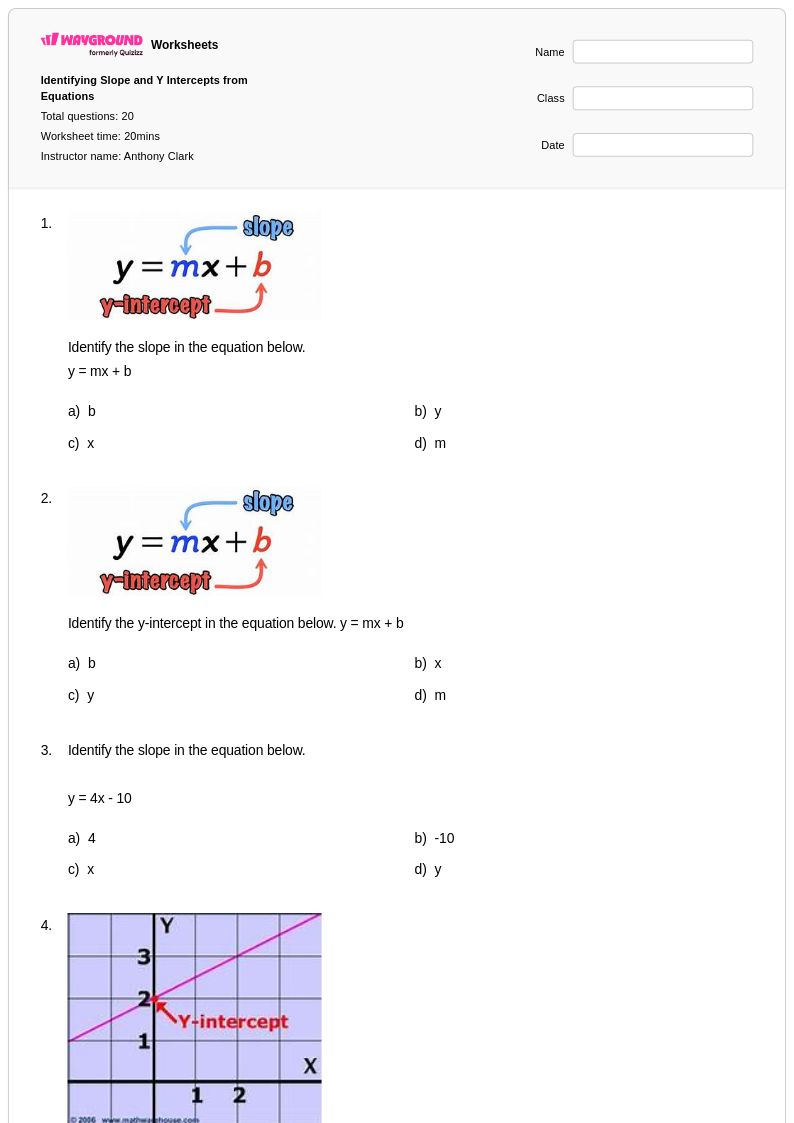
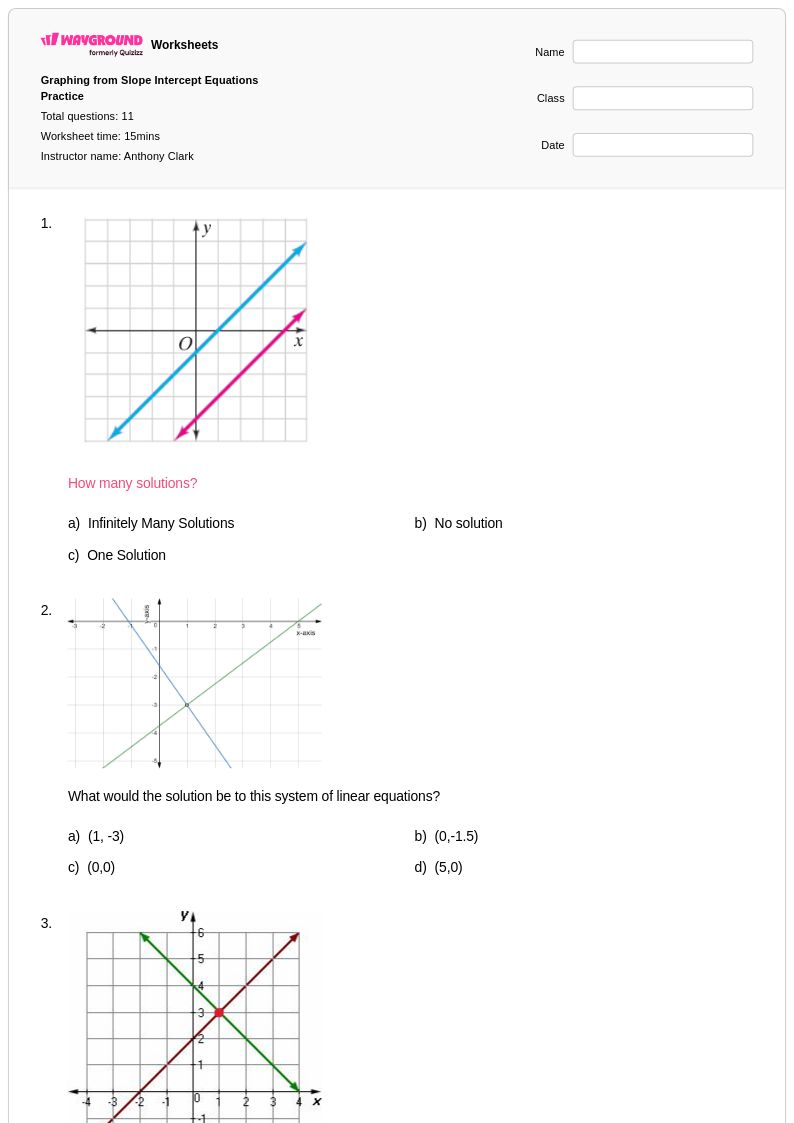
Identifying slope from a graph represents a fundamental skill in mathematics that bridges visual interpretation with algebraic concepts. Wayground's comprehensive collection of worksheets focuses specifically on helping students master this critical ability by providing structured practice problems that guide learners through the process of determining slope using rise over run calculations, coordinate points, and visual graph analysis. These free printable resources strengthen students' understanding of how to read graphs systematically, calculate slope values accurately, and connect graphical representations to numerical expressions. Each worksheet includes detailed answer keys that allow students to verify their work and understand common mistakes, while the pdf format ensures easy access for both classroom instruction and independent study sessions.
Wayground, formerly Quizizz, empowers educators with millions of teacher-created resources specifically designed for slope identification and related mathematical concepts, all searchable through robust filtering tools that help locate materials aligned with curriculum standards and learning objectives. Teachers can easily customize these worksheet collections to match their students' skill levels, creating differentiated assignments that support both remediation for struggling learners and enrichment opportunities for advanced students. The platform's flexible delivery options include traditional printable worksheets and interactive digital formats, enabling seamless integration into diverse classroom environments and teaching styles. These comprehensive tools streamline lesson planning while providing targeted skill practice that helps students build confidence in graph interpretation and slope calculation through repeated, purposeful engagement with varied problem types.
FAQs
How do I teach students to find slope from a graph?
What kind of practice helps students master identifying slope?
What are common mistakes when identifying slope from a graph?
How can I use this worksheet in my classroom?
How does finding slope from a graph fit into the math curriculum?
How can I differentiate this topic for diverse learners?