
16 Q
9th - 12th
11 Q
9th - 12th
26 Q
9th - Uni
33 Q
9th - 12th
20 Q
3rd - Uni
20 Q
9th - 12th
25 Q
9th - 12th
25 Q
9th - 12th
50 Q
10th
15 Q
8th - Uni
14 Q
9th - 12th
24 Q
9th - 12th
100 Q
8th - 10th
8 Q
7th - 12th
12 Q
9th - 12th

13 Q
9th - 12th
45 Q
9th - 12th
12 Q
7th - 12th
18 Q
9th - 12th
14 Q
4th - Uni
20 Q
4th - Uni
10 Q
7th - 12th
20 Q
7th - 12th
28 Q
9th - 12th
Explore Other Subject Worksheets for grade 10
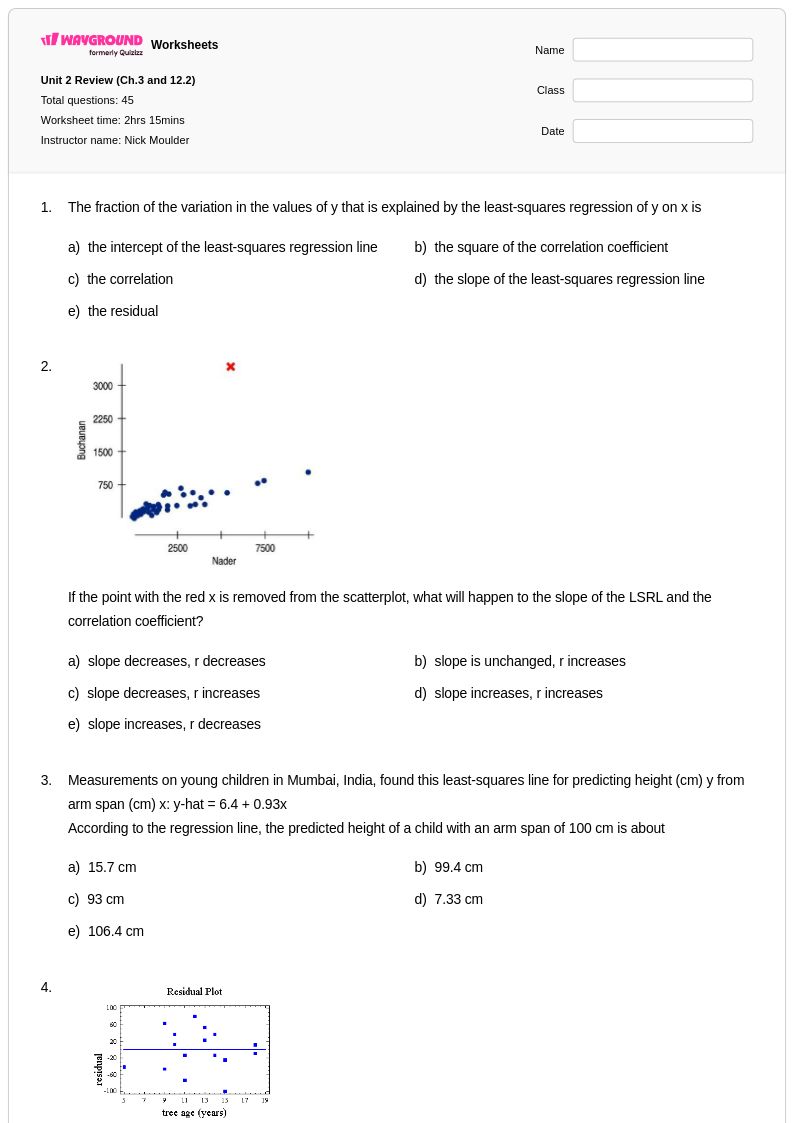
Explore printable Residual Plots worksheets for Grade 10
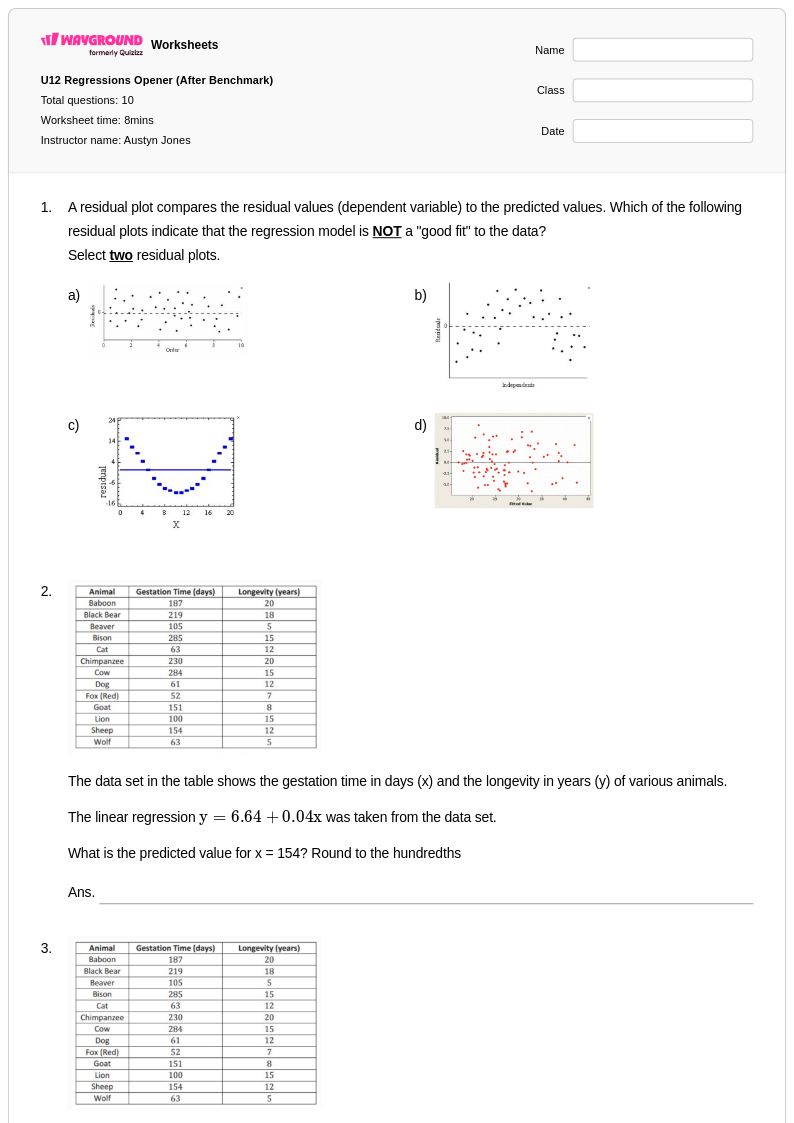
Residual plots serve as a critical diagnostic tool in Grade 10 statistics, helping students evaluate the appropriateness of linear regression models and identify patterns in data that may indicate model inadequacy. Wayground's comprehensive collection of residual plot worksheets provides students with essential practice in creating, interpreting, and analyzing these scatter plots that display residuals versus fitted values or explanatory variables. These carefully designed practice problems strengthen students' ability to recognize random scatter patterns that indicate good model fit, as well as identify problematic patterns such as curves, funneling, or outliers that suggest violations of regression assumptions. Each worksheet includes detailed answer keys and explanations that guide students through the process of constructing residual plots, calculating residuals, and drawing appropriate conclusions about model validity, making these free printable resources invaluable for mastering this fundamental statistical concept.
Wayground's extensive library draws from millions of teacher-created resources specifically focused on residual plots and statistical analysis, offering educators powerful search and filtering capabilities to locate materials perfectly suited to their Grade 10 mathematics curriculum needs. The platform's robust standards alignment ensures that residual plot worksheets meet specific learning objectives while providing differentiation tools that allow teachers to customize content difficulty and complexity for diverse student populations. These flexible resources are available in both printable pdf format and interactive digital versions, enabling seamless integration into various instructional approaches whether for initial concept introduction, targeted skill practice, remediation support, or enrichment activities. Teachers can efficiently adapt these comprehensive worksheet collections to address individual student needs, reinforce statistical reasoning skills, and build confidence in interpreting residual plot patterns across different mathematical contexts.