
33Q
6th
15Q
6th - 9th
28Q
6th - 11th
45Q
6th
12Q
6th - 10th
20Q
6th - 8th
14Q
6th
10Q
6th - 8th
10Q
6th - 8th
6Q
4th - 6th
8Q
5th - 6th
15Q
6th
17Q
6th - 8th
20Q
6th
15Q
6th - 7th
10Q
6th - 12th
10Q
6th
16Q
6th - 8th
22Q
6th - 7th
14Q
6th
28Q
6th
9Q
6th
11Q
6th - 8th
15Q
6th - 8th
Explore planilhas Interpreting Graphs por notas
Explore outras planilhas de assuntos para class 6
Explore printable Interpreting Graphs worksheets for Class 6
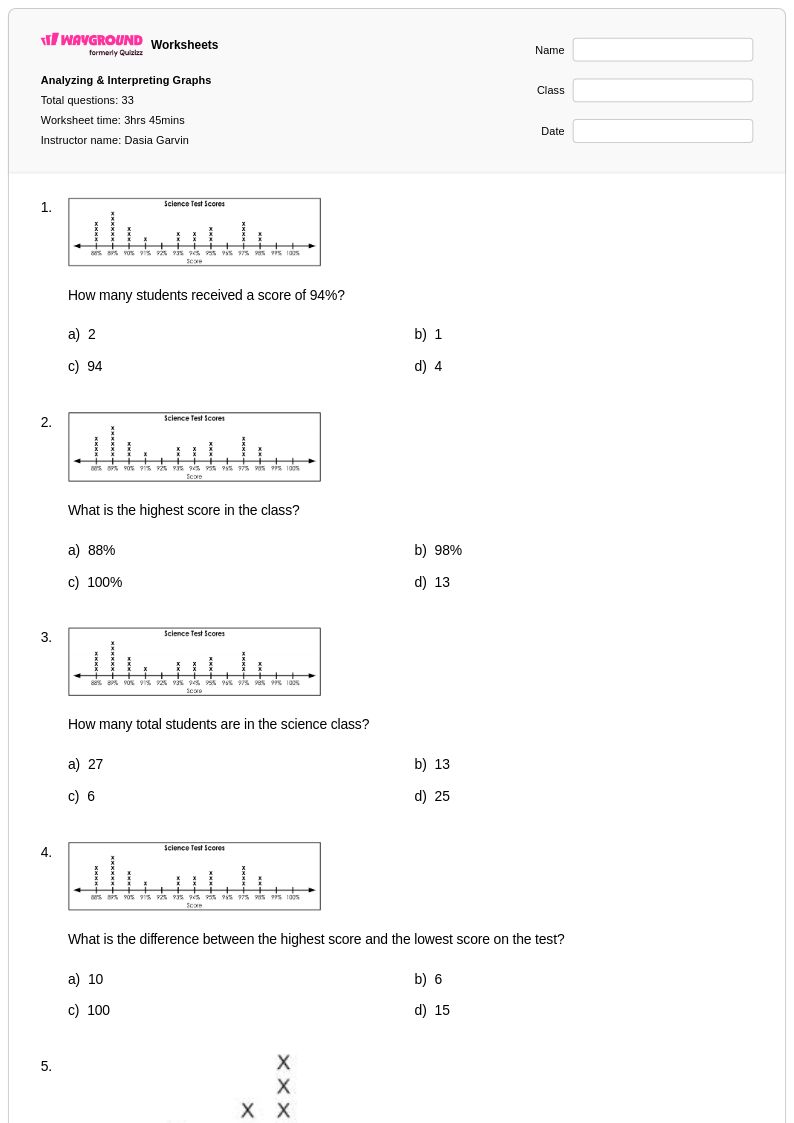
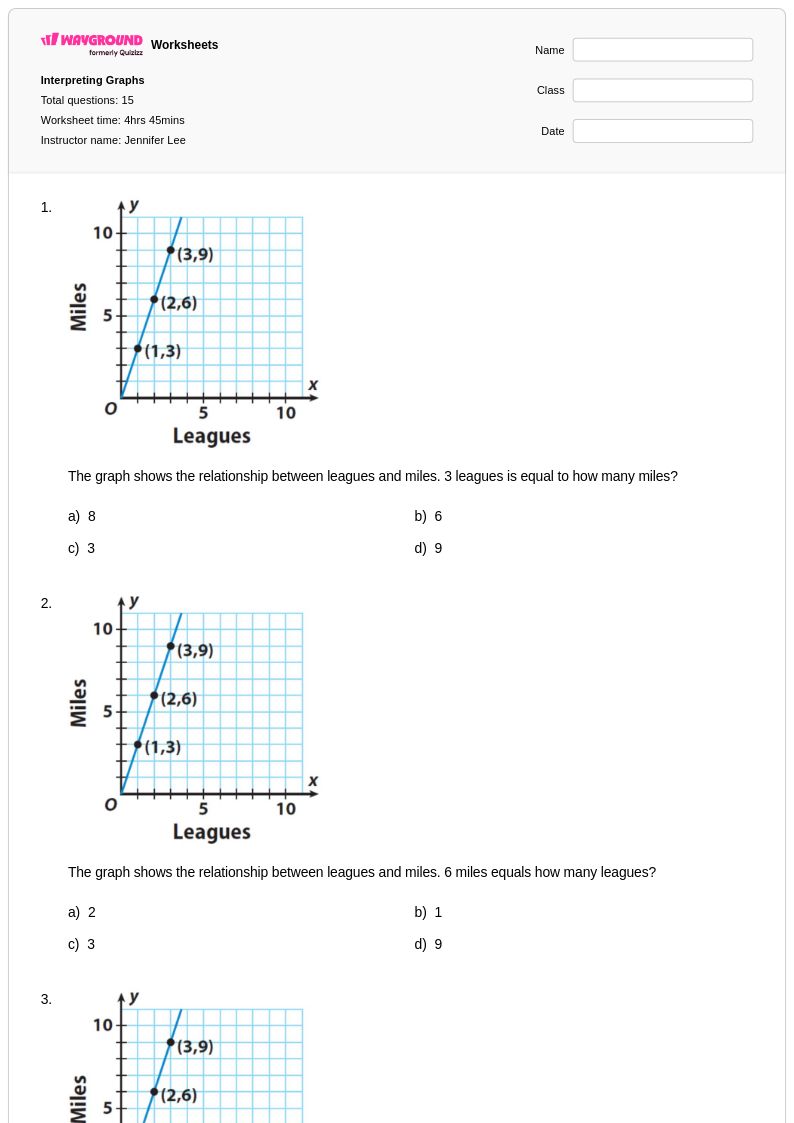
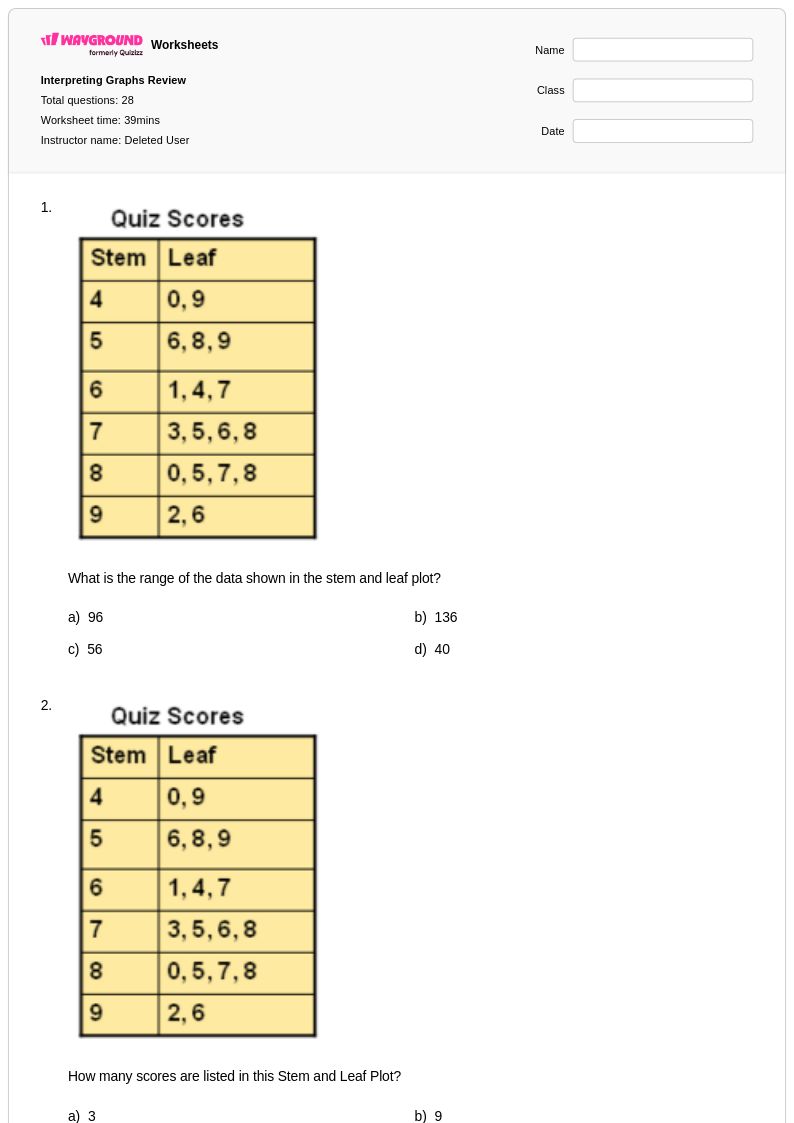
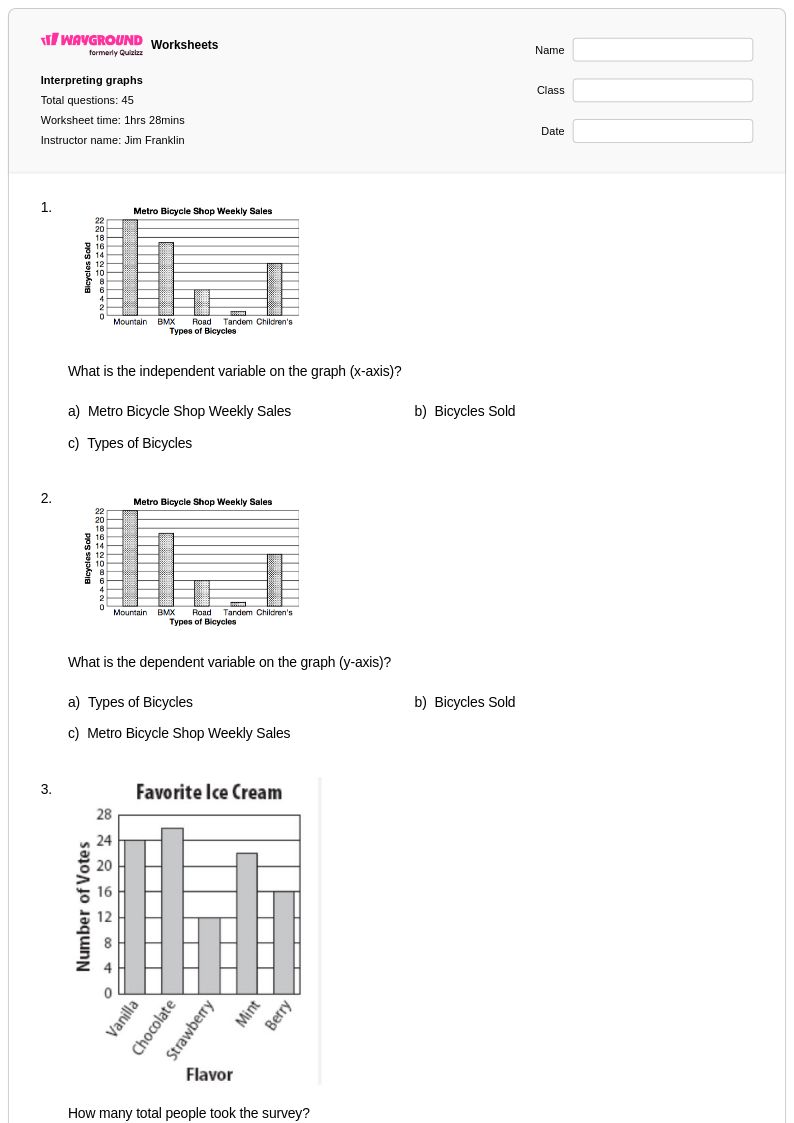
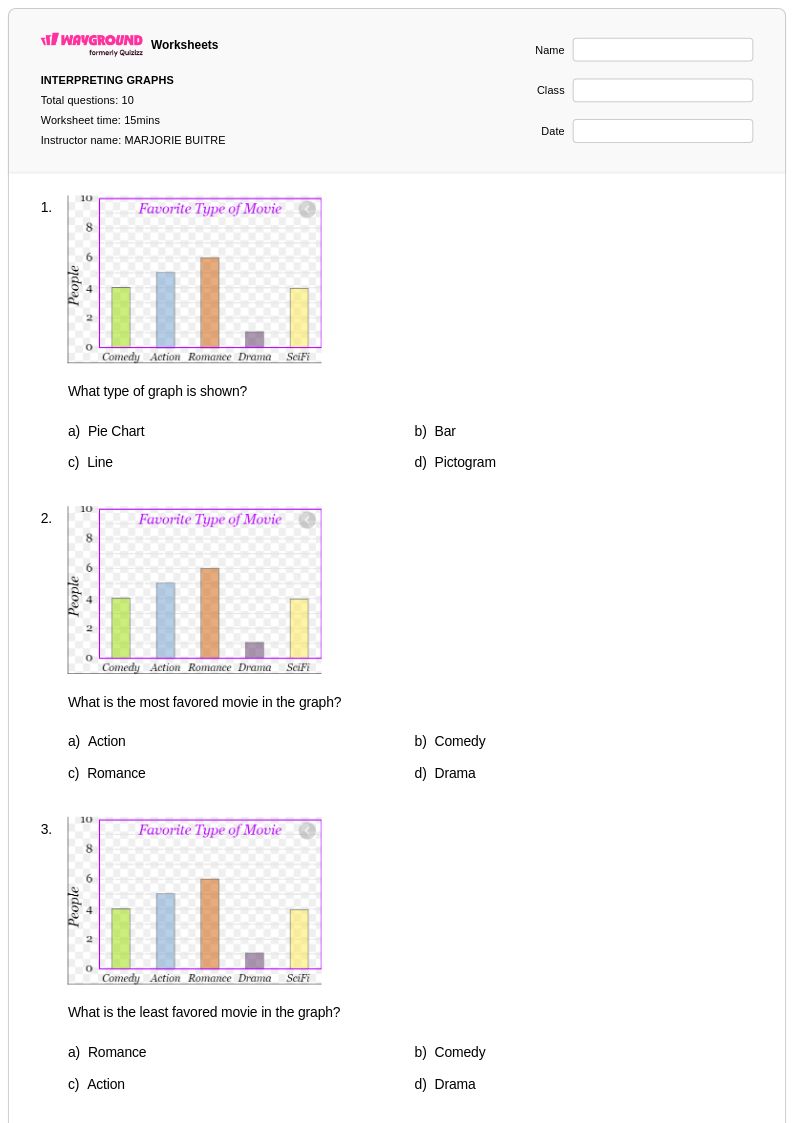
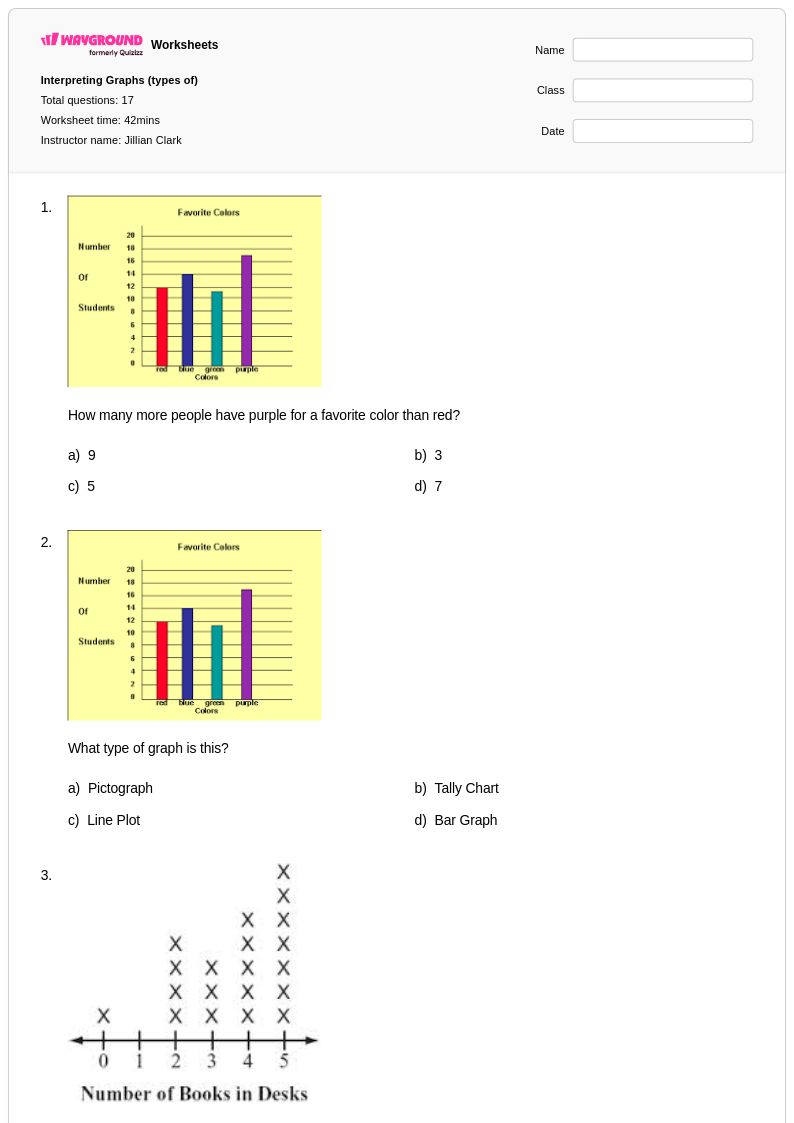
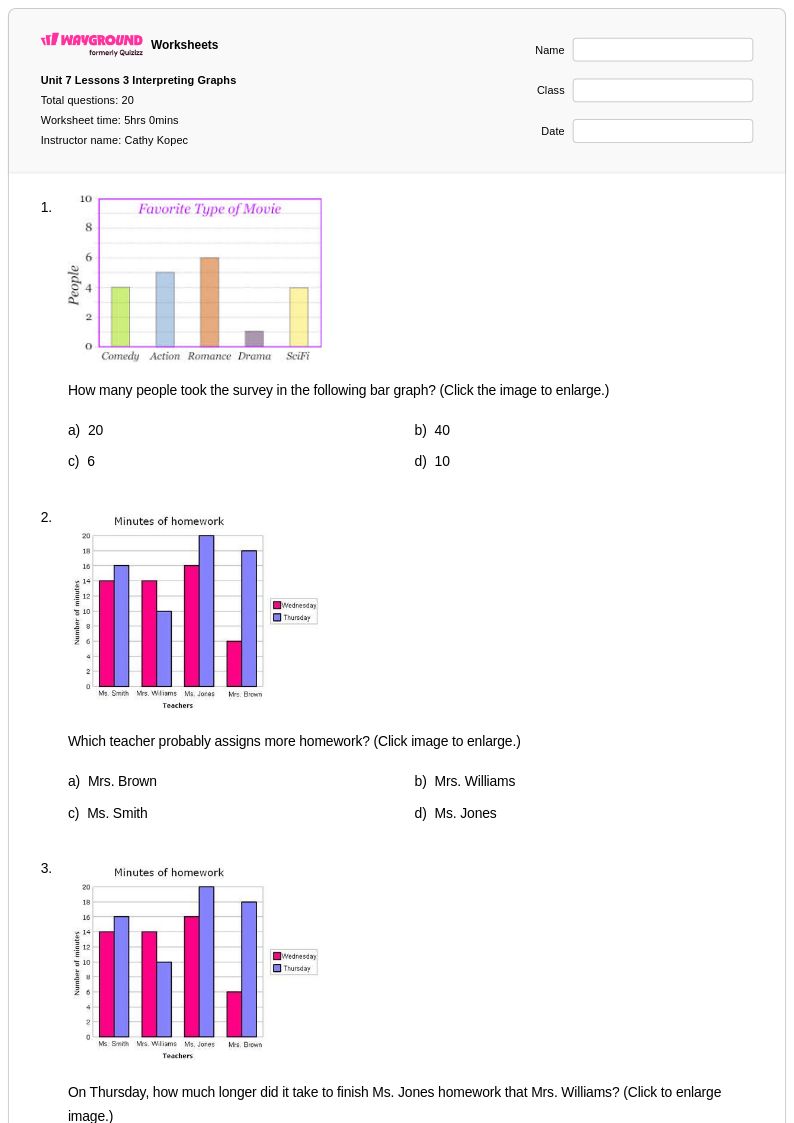
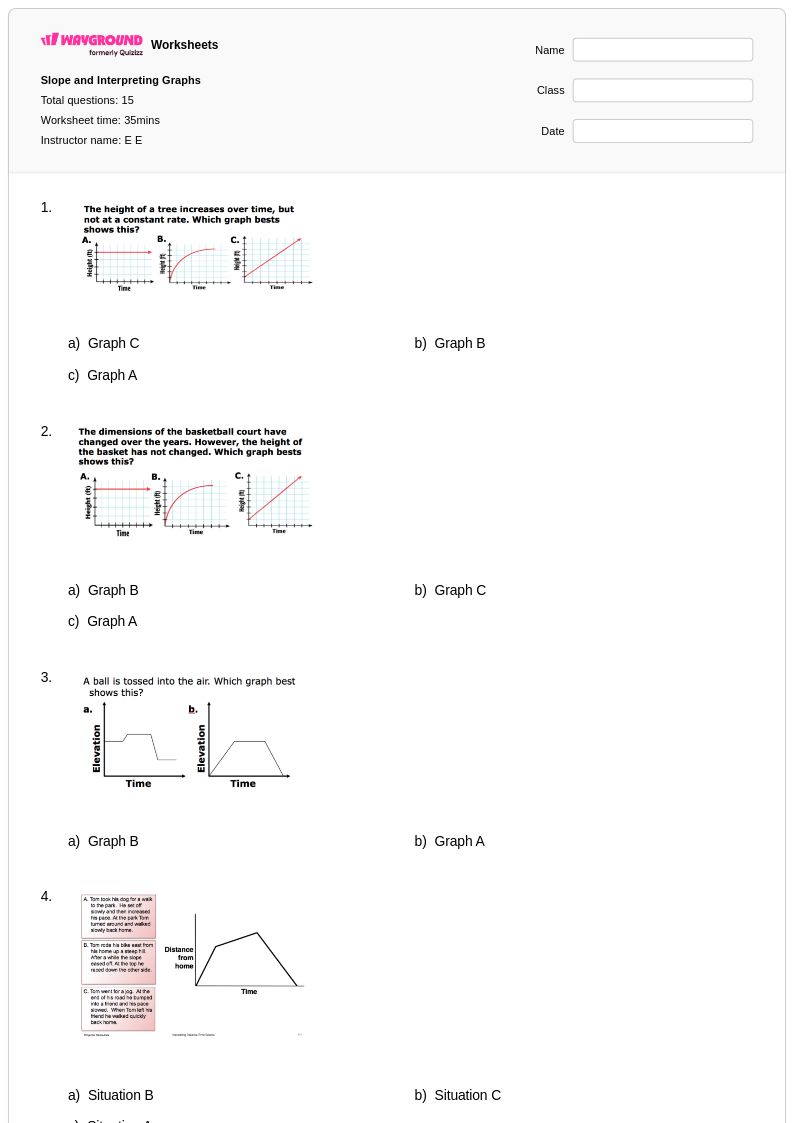
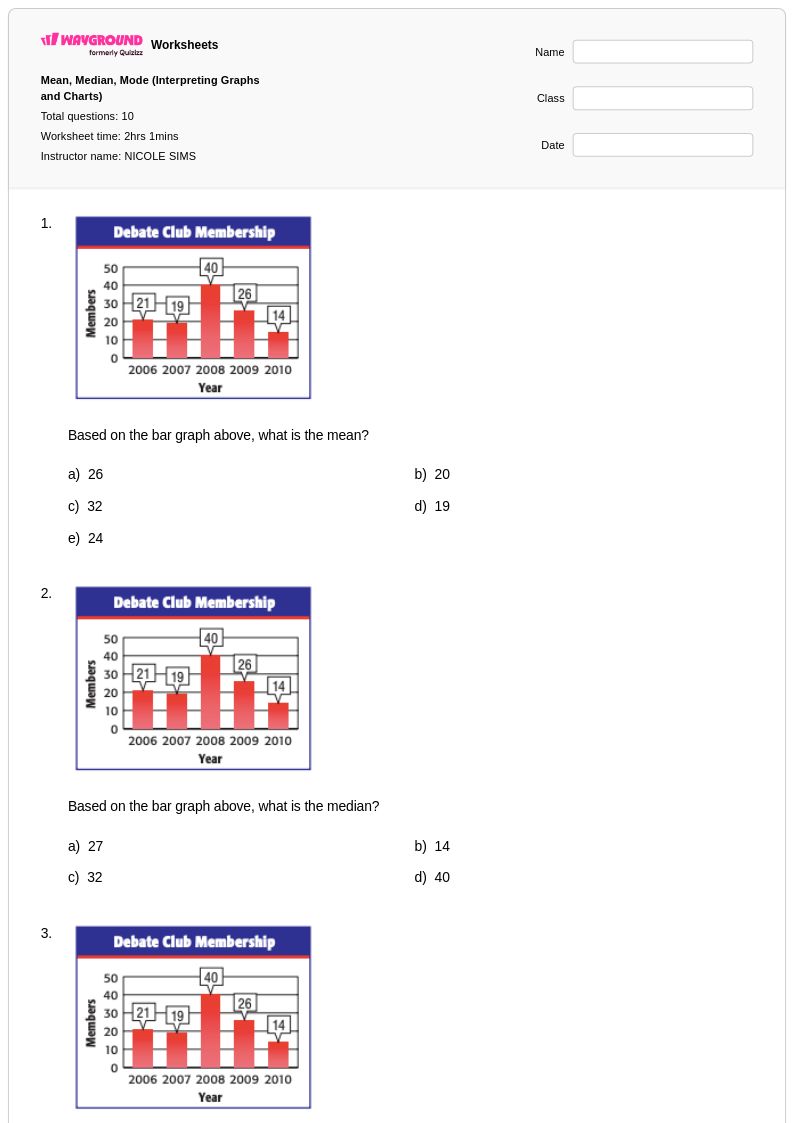
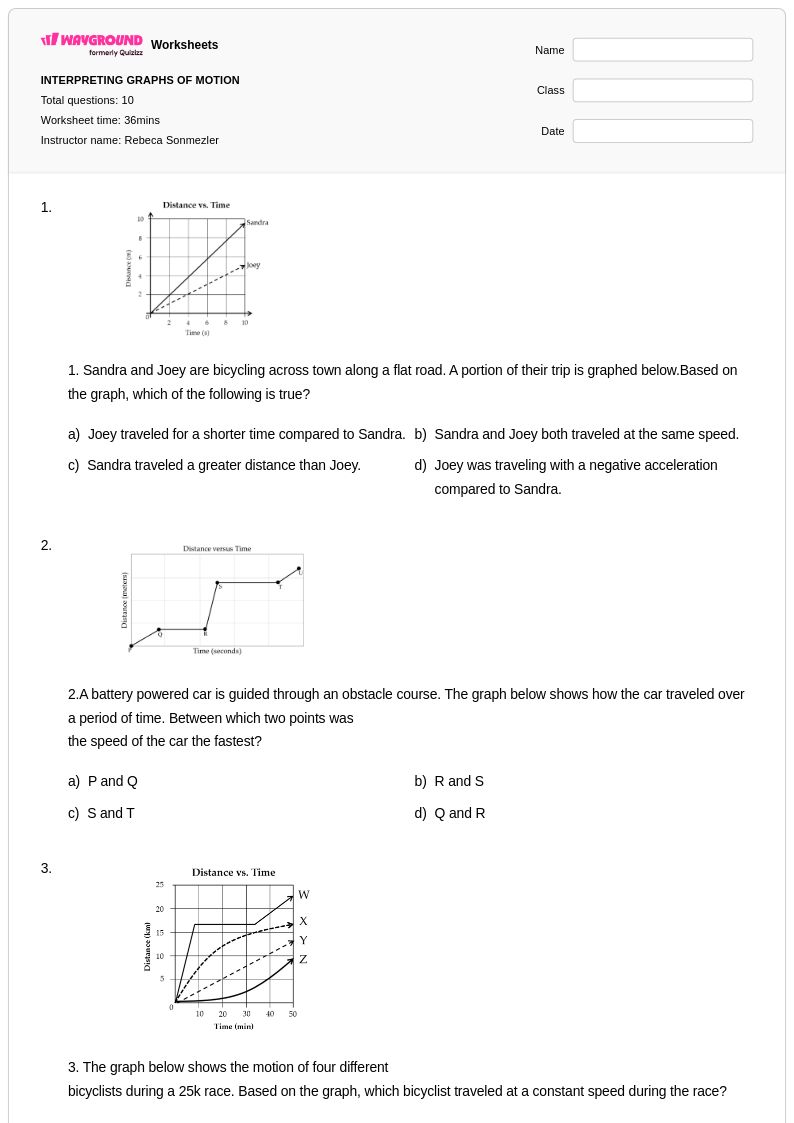
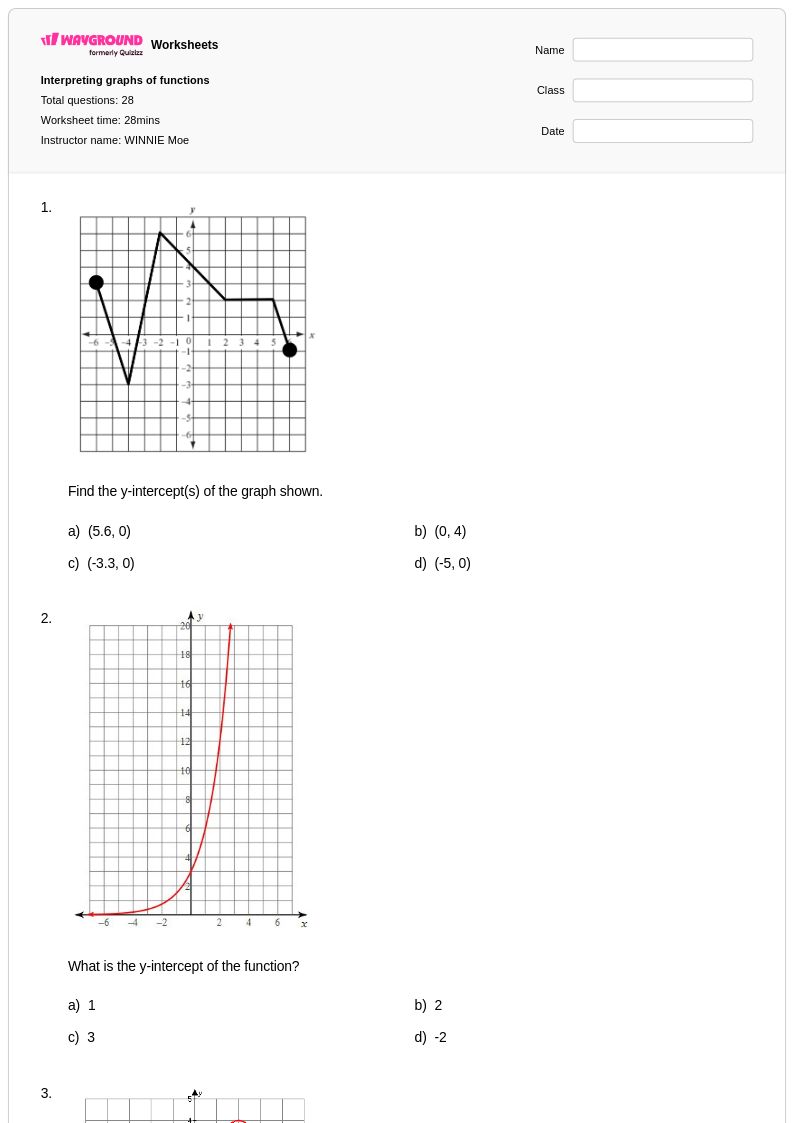
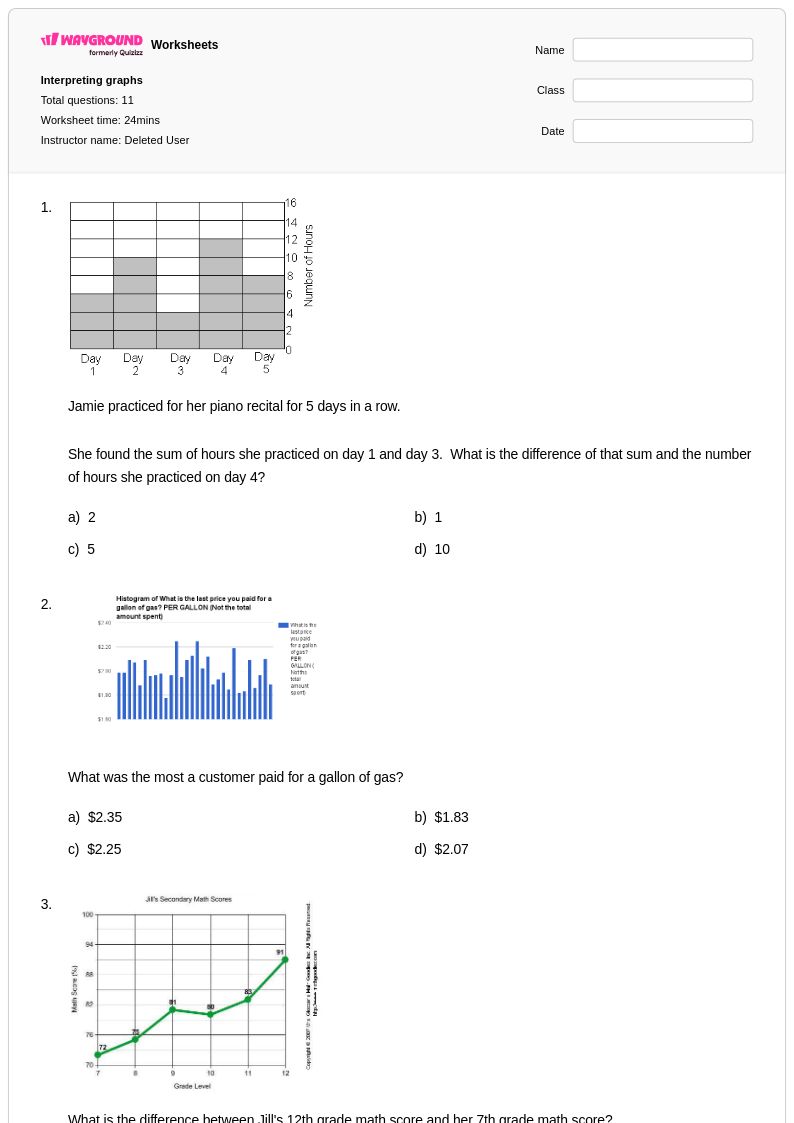
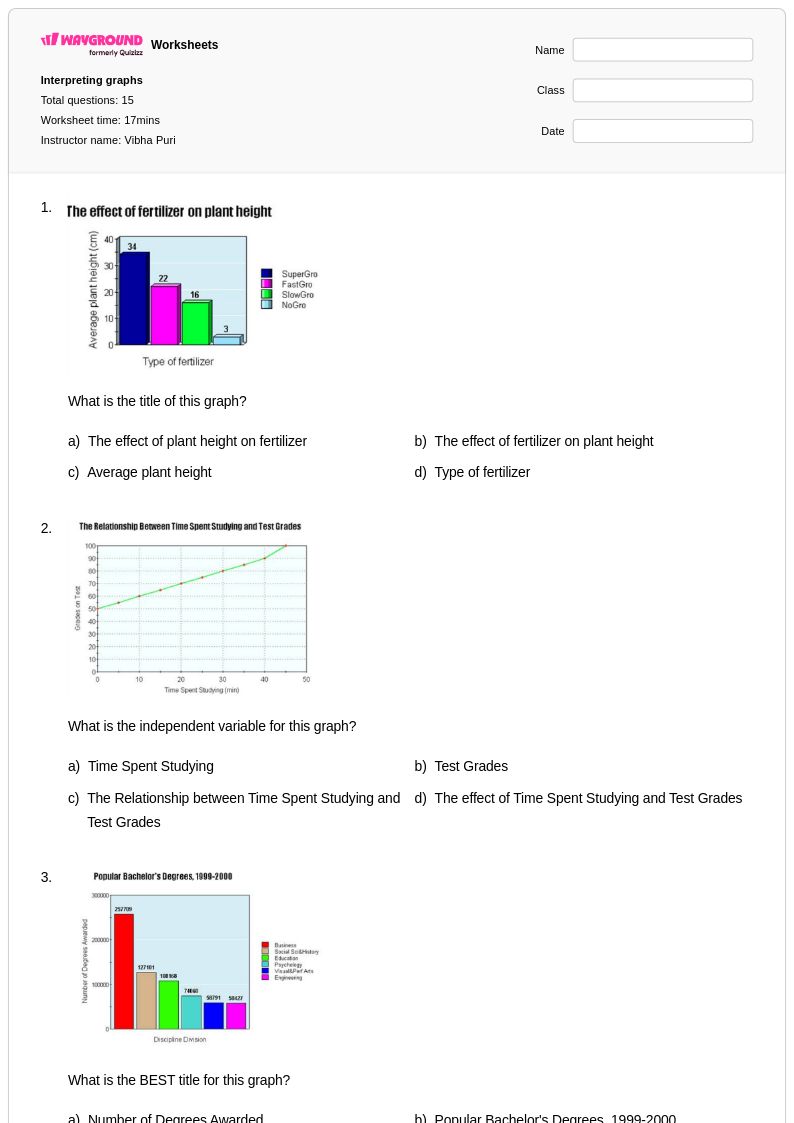
Interpreting graphs worksheets for Class 6 students available through Wayground (formerly Quizizz) provide comprehensive practice in analyzing and extracting meaningful information from various visual data representations. These educational resources strengthen critical mathematical skills including reading coordinate points, identifying trends and patterns, comparing data sets, and drawing conclusions from bar graphs, line graphs, scatter plots, and pie charts. The practice problems systematically guide students through the process of examining graph components such as titles, axes labels, scales, and data points to answer questions about real-world scenarios. Each worksheet collection includes detailed answer keys and is available as free printable pdf resources, allowing students to develop confidence in translating visual information into mathematical understanding and logical reasoning.
Wayground (formerly Quizizz) empowers educators with millions of teacher-created interpreting graphs worksheet collections specifically designed to meet diverse Class 6 classroom needs. The platform's robust search and filtering capabilities enable teachers to quickly locate resources aligned with specific learning standards and student ability levels, while built-in differentiation tools support both remediation for struggling learners and enrichment opportunities for advanced students. Teachers can seamlessly customize worksheets to match their lesson objectives and assessment requirements, with flexible delivery options including printable pdf formats for traditional paper-and-pencil practice and digital formats for technology-integrated learning environments. These comprehensive features streamline lesson planning while providing targeted skill practice that helps students master the essential mathematical literacy skills needed to interpret and analyze graphical data representations across various academic disciplines.