
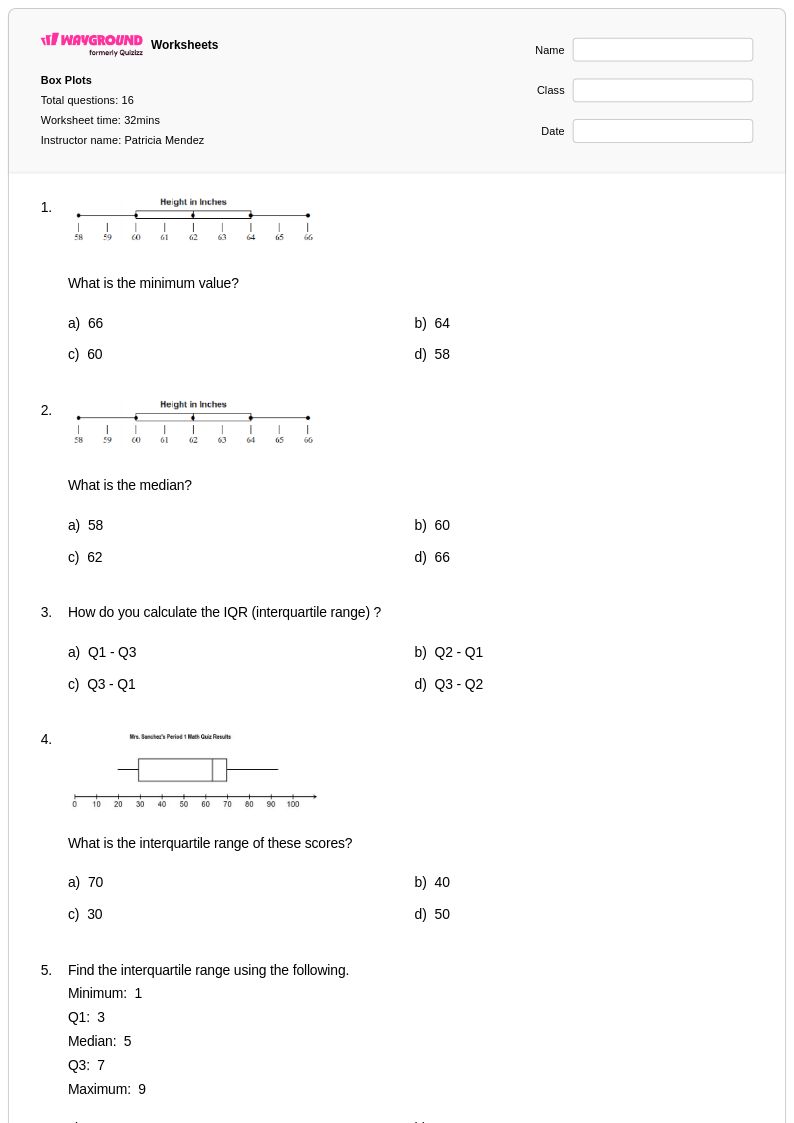
16 Q
9th
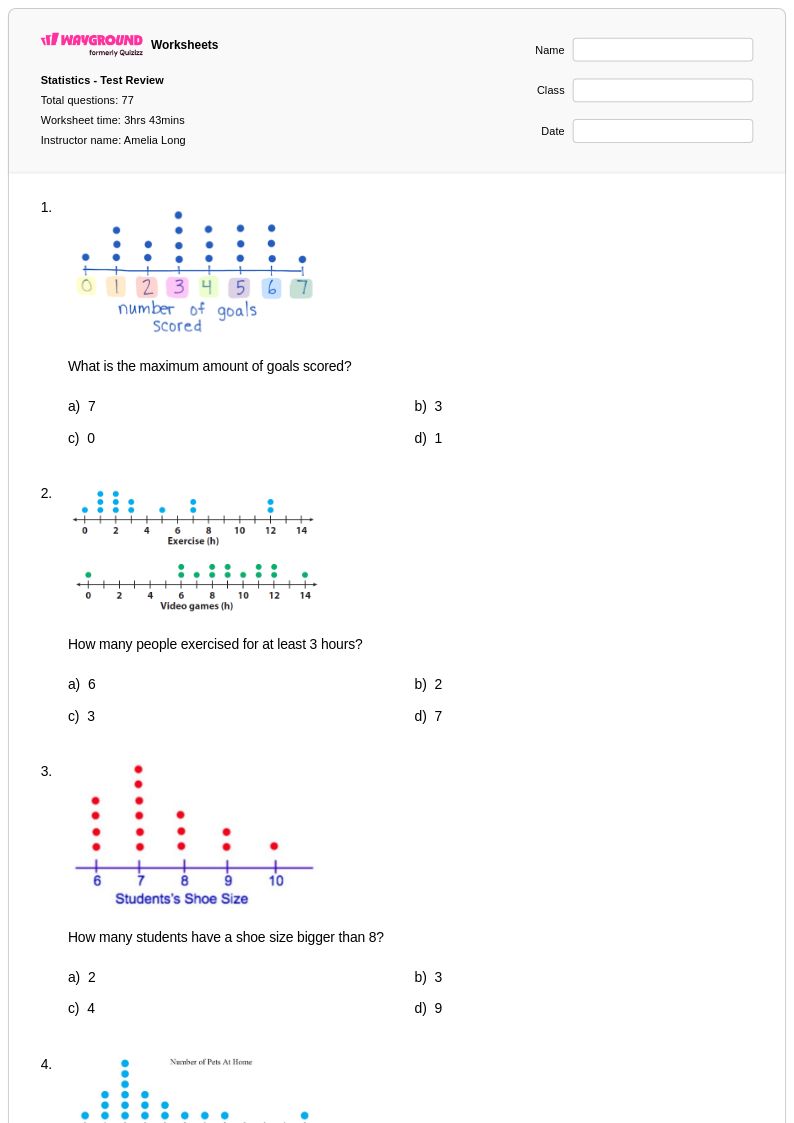
77 Q
9th
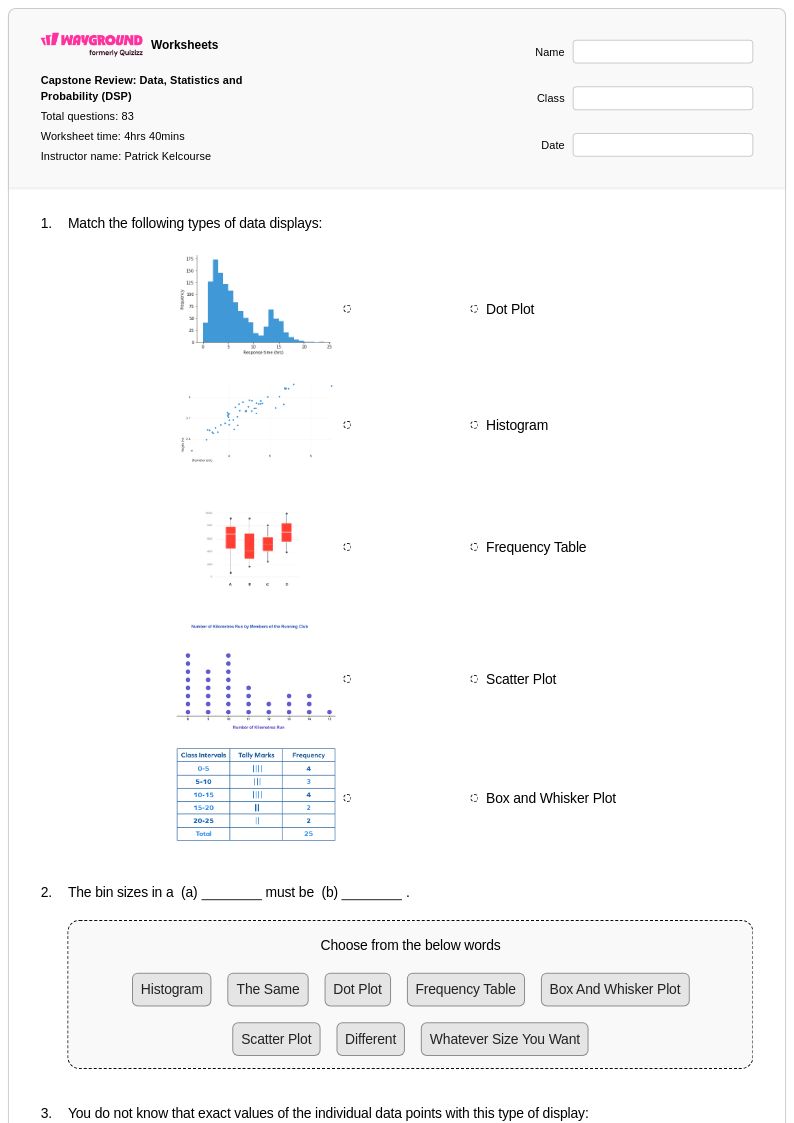
83 Q
9th
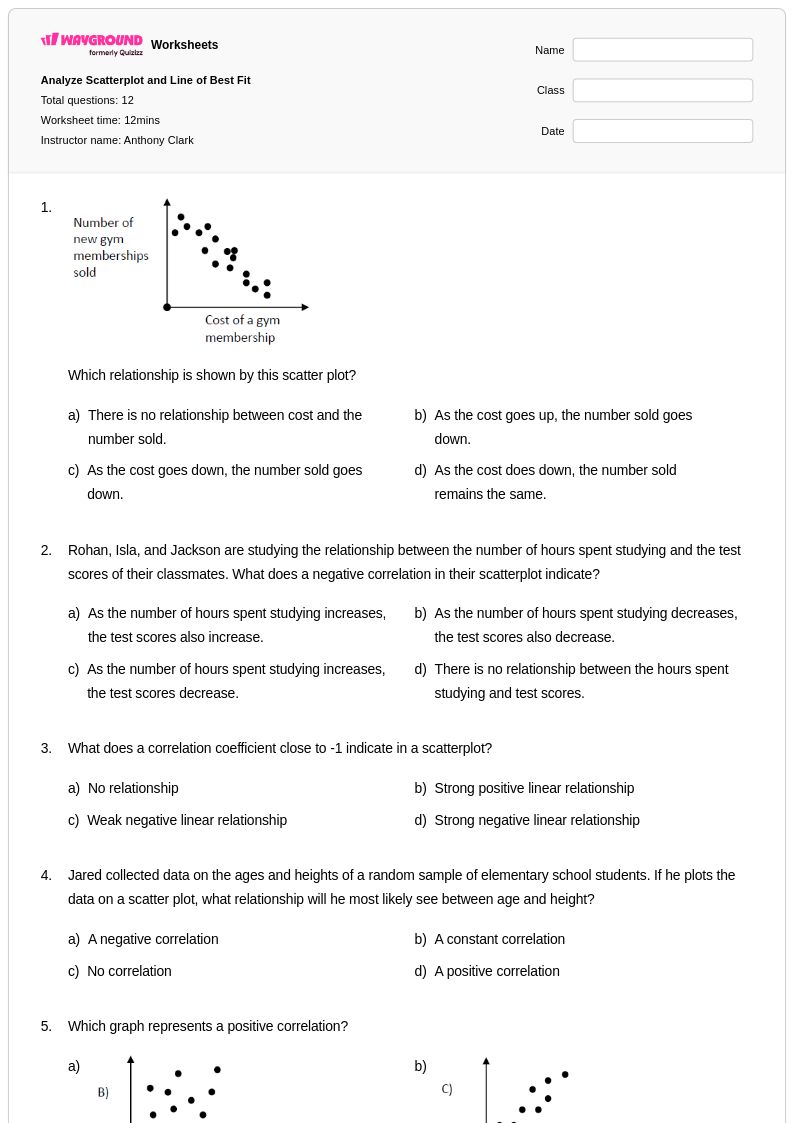
12 Q
8th - Uni
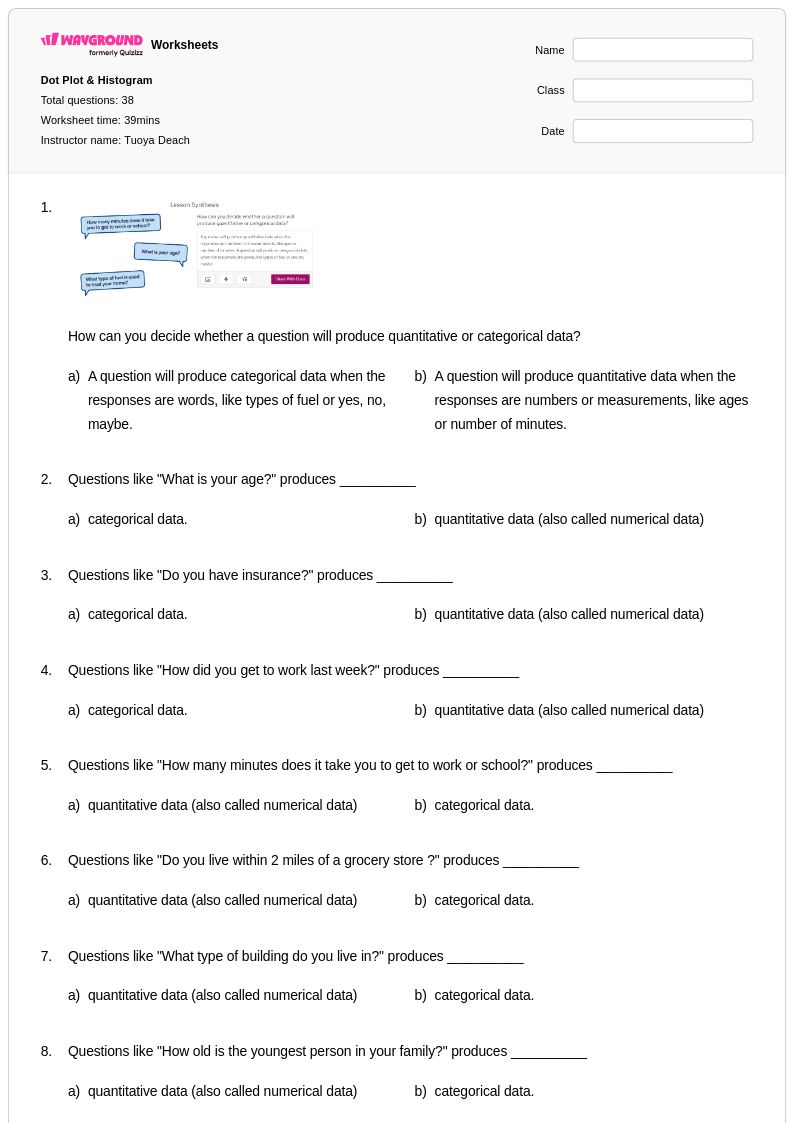
38 Q
9th
23 Q
9th - Uni
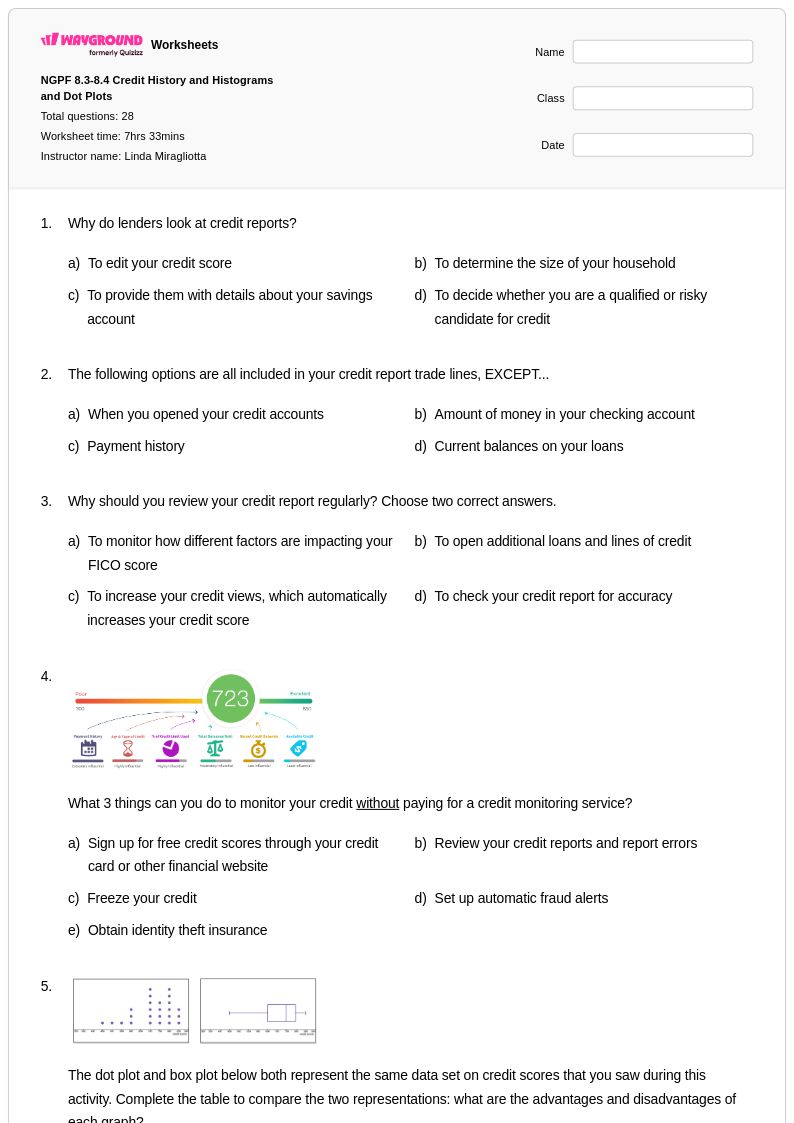
28 Q
9th - 12th
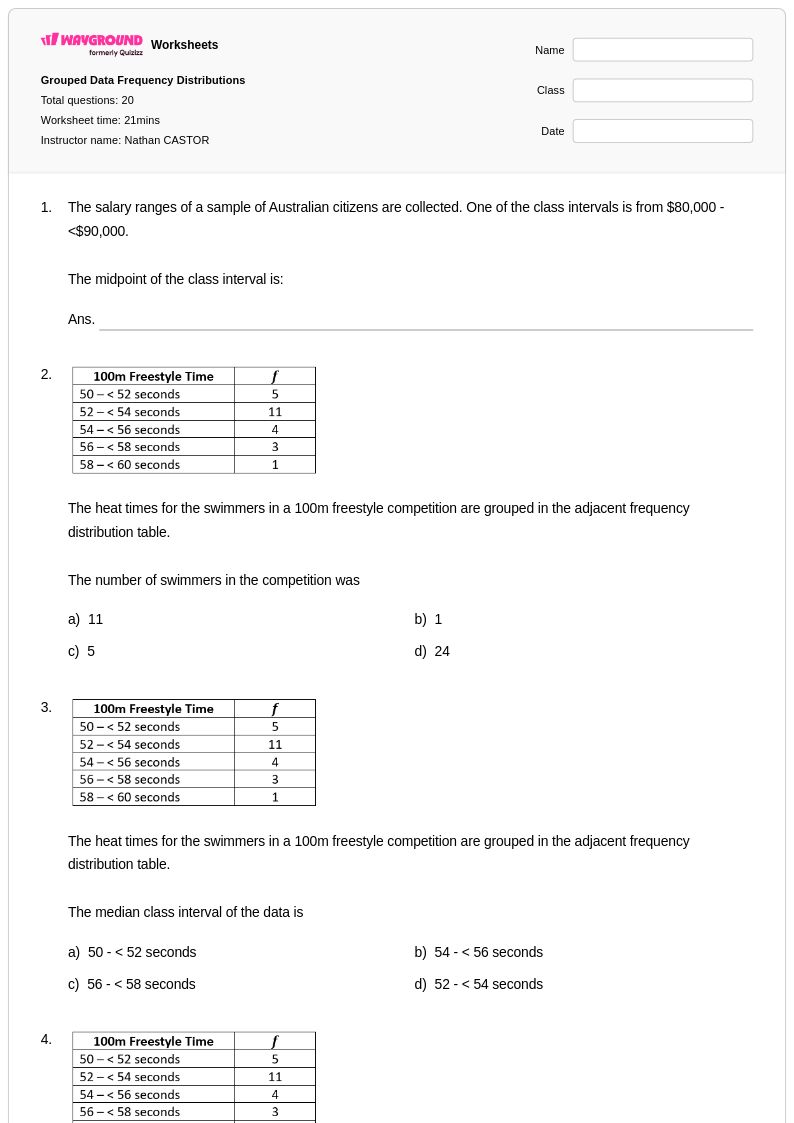
20 Q
9th
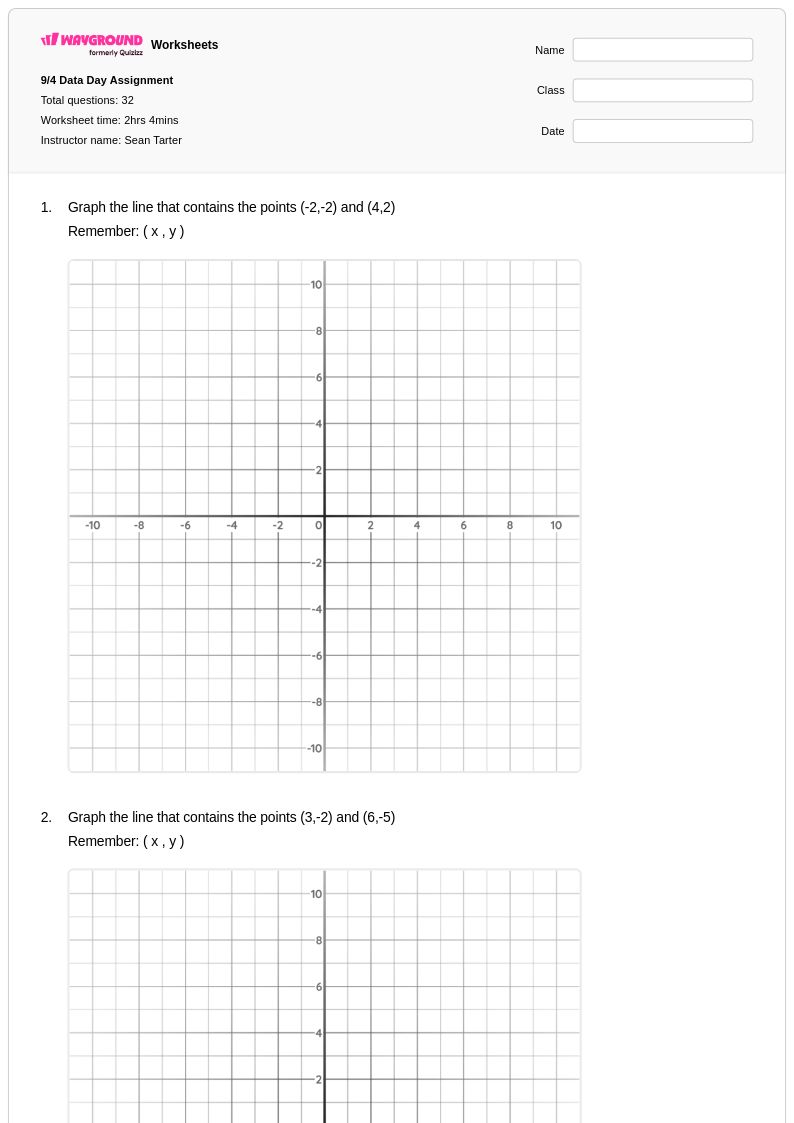
32 Q
9th
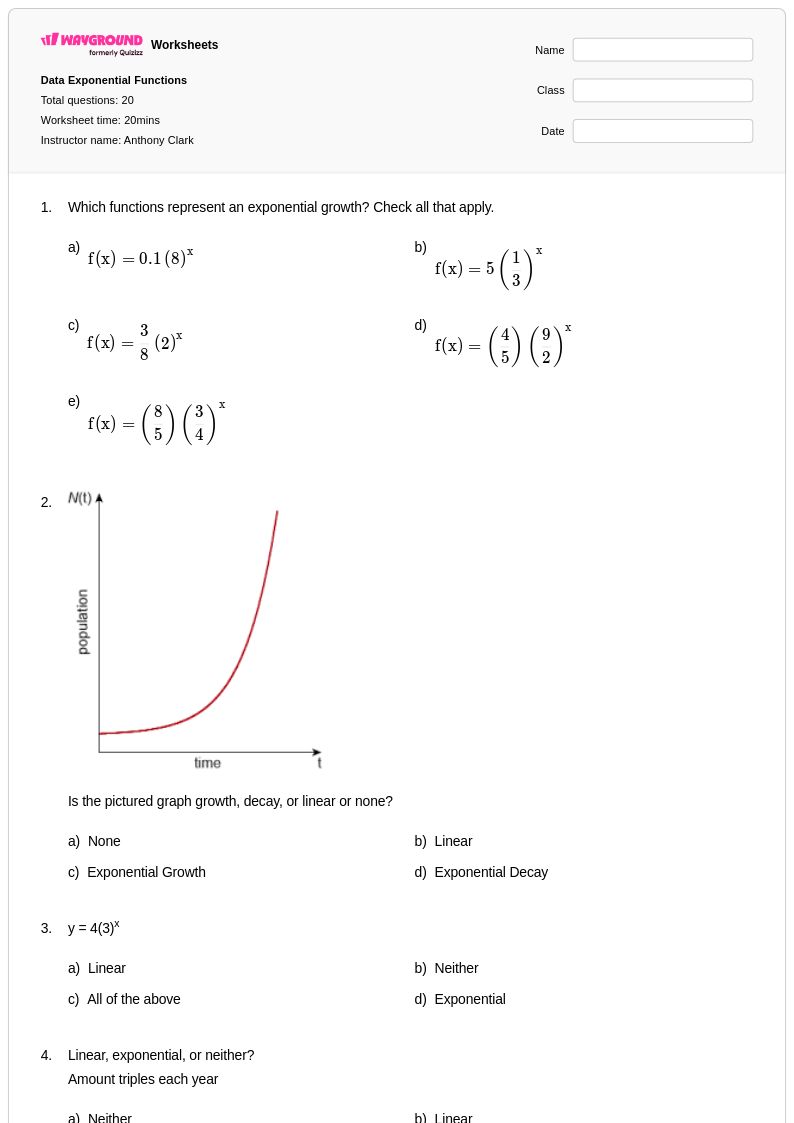
20 Q
9th - Uni
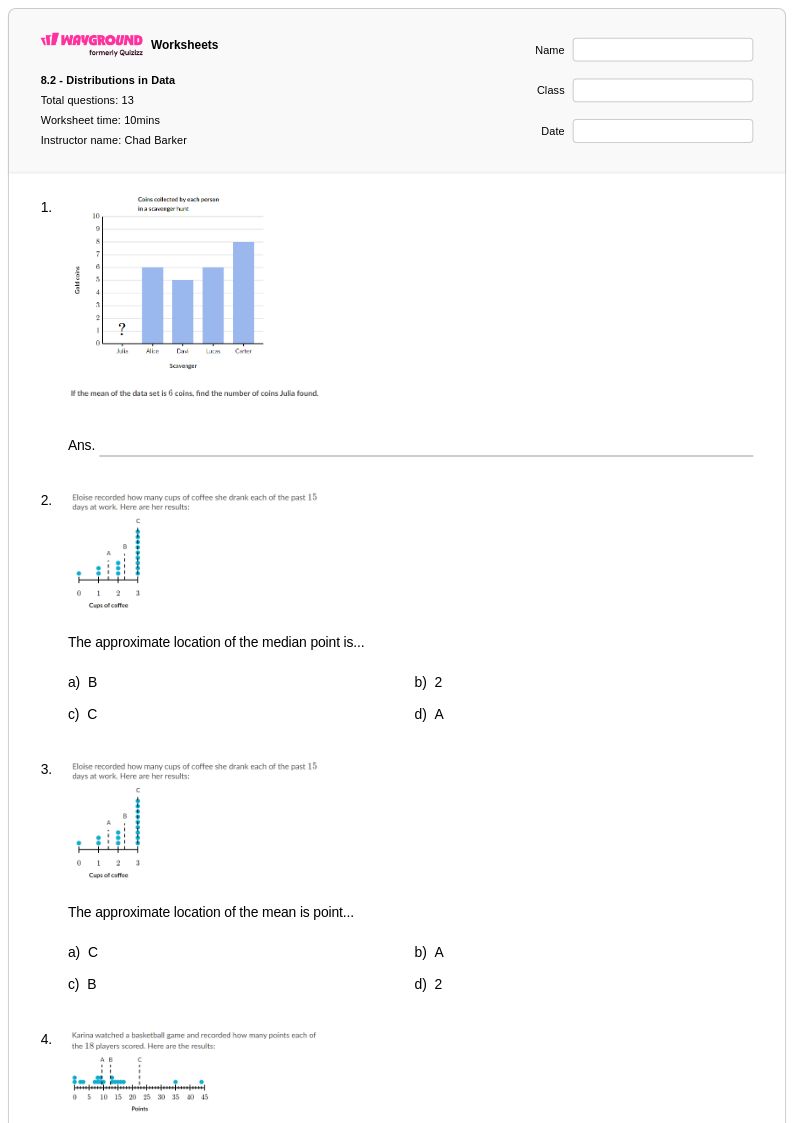
13 Q
9th
17 Q
7th - Uni
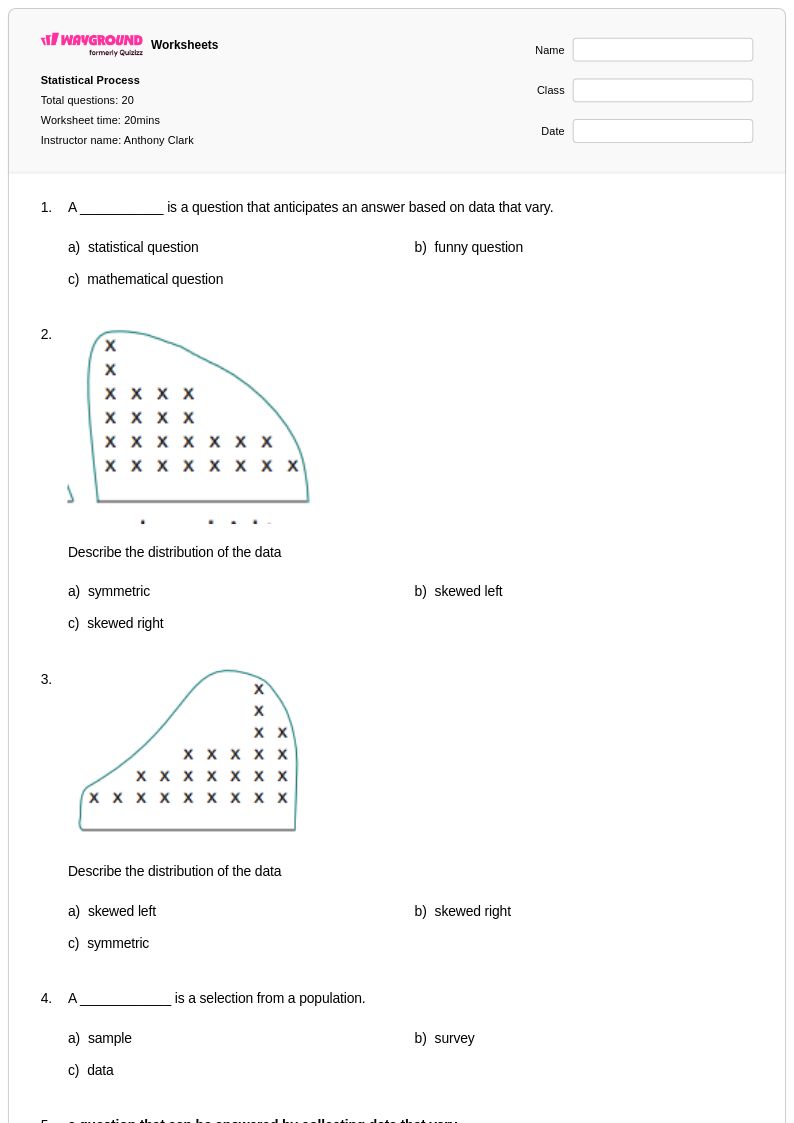
20 Q
6th - Uni
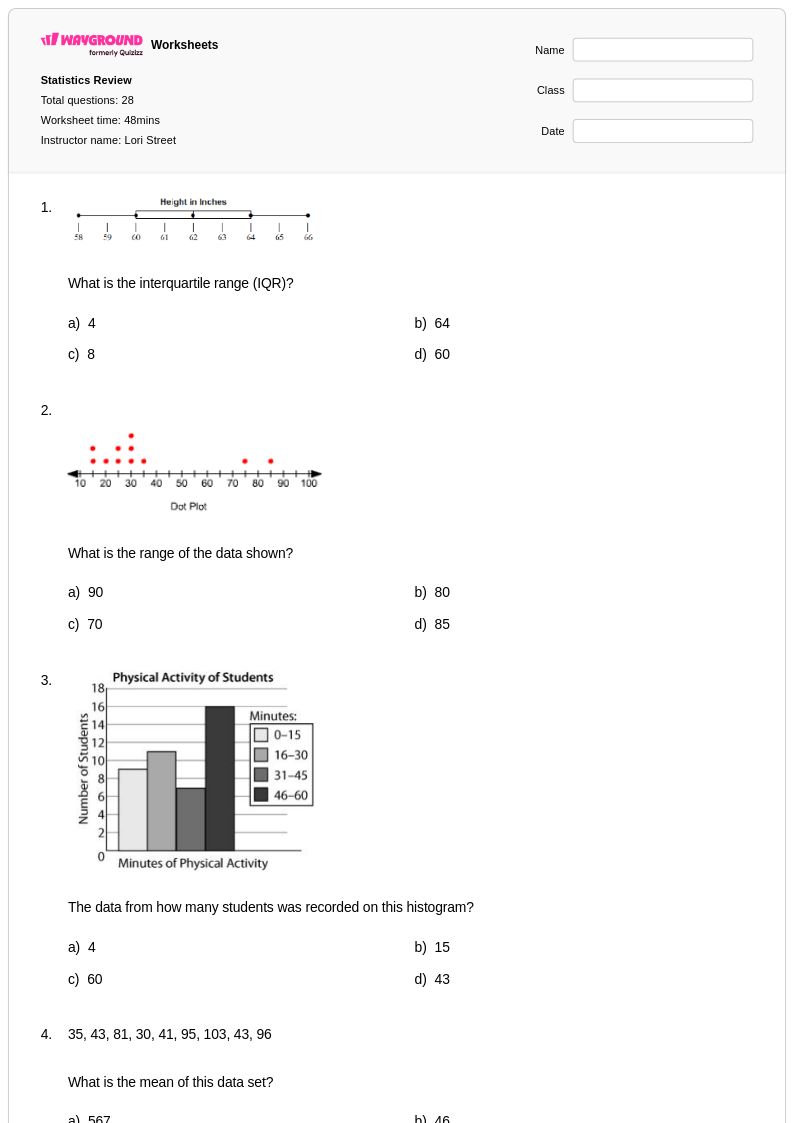
28 Q
9th - 12th

15 Q
5th - Uni
11 Q
6th - 10th
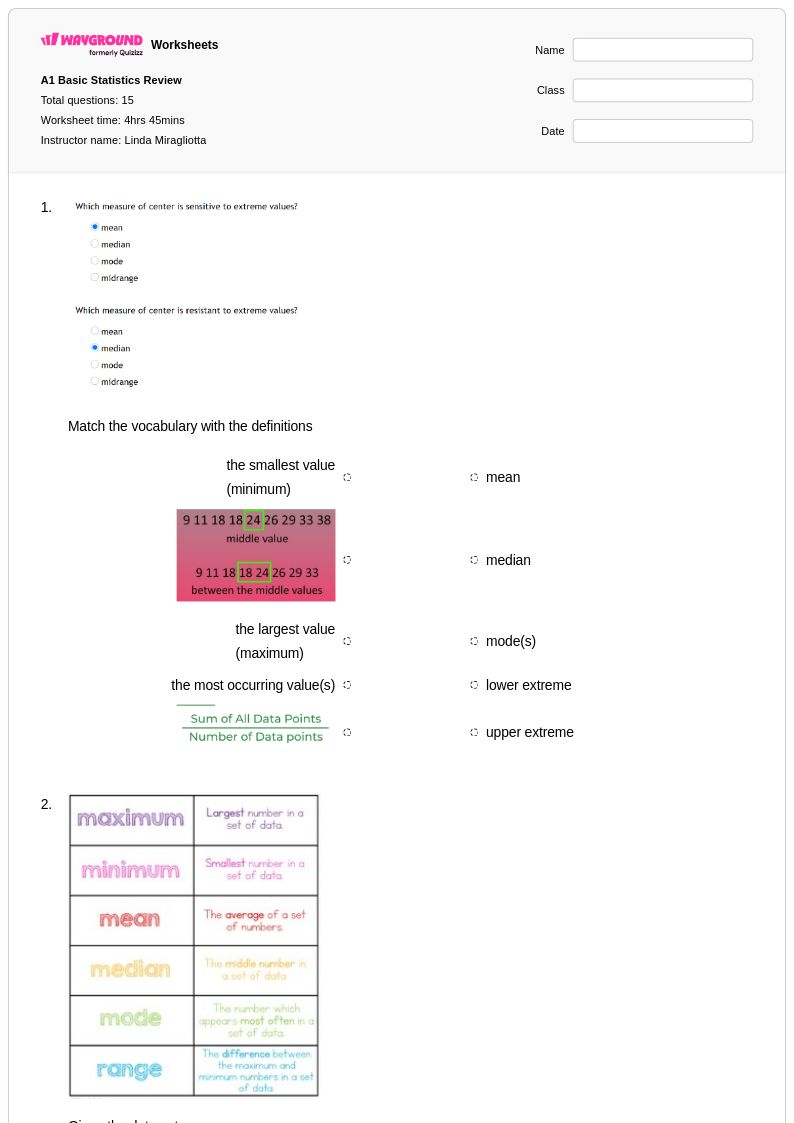
15 Q
9th
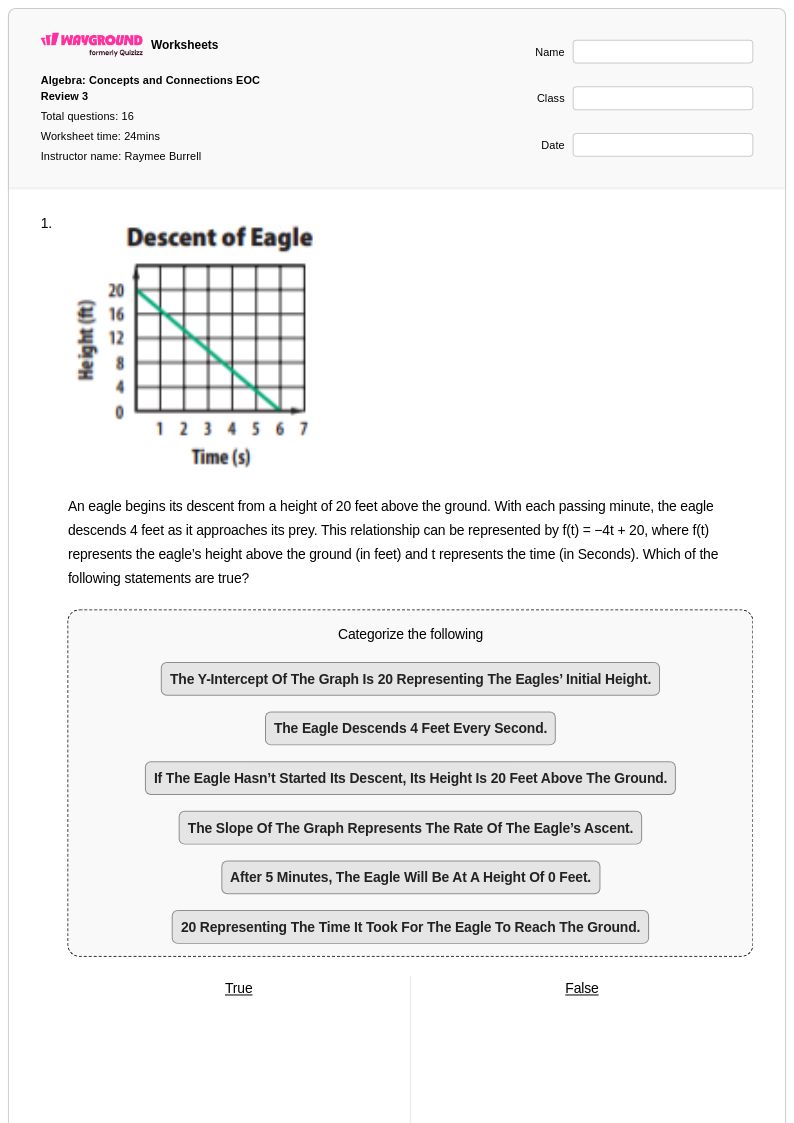
16 Q
9th
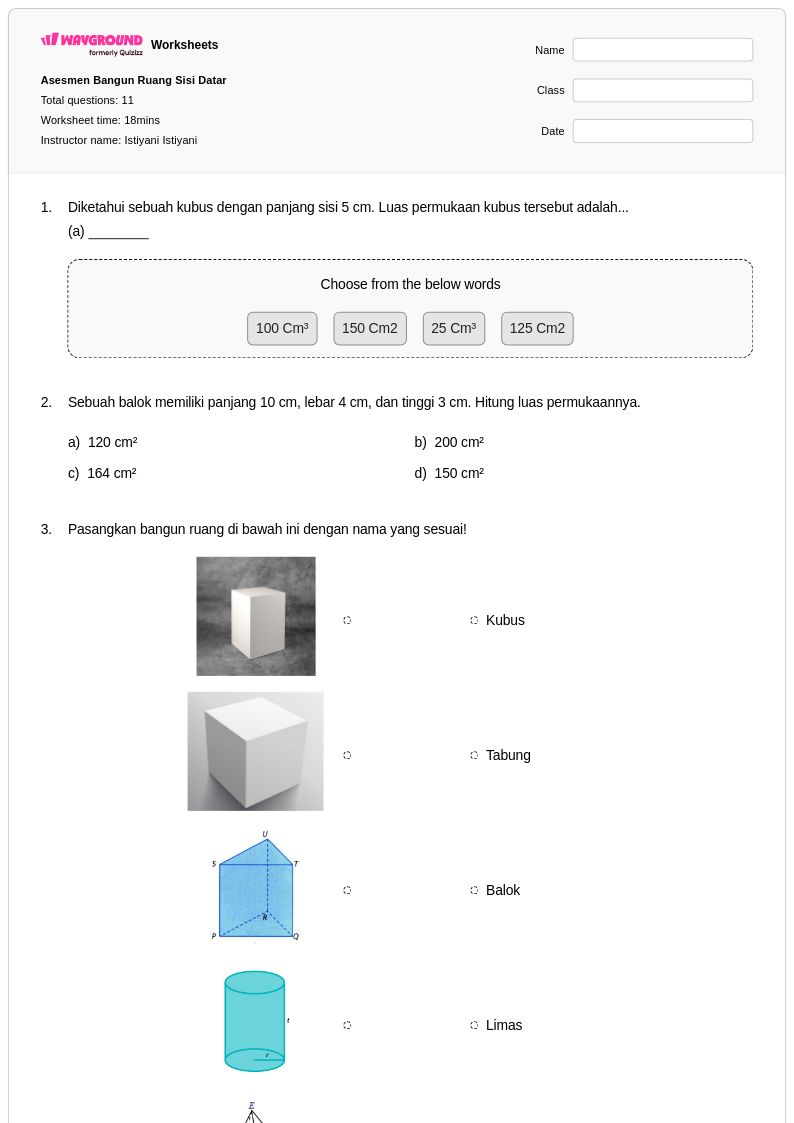
11 Q
9th
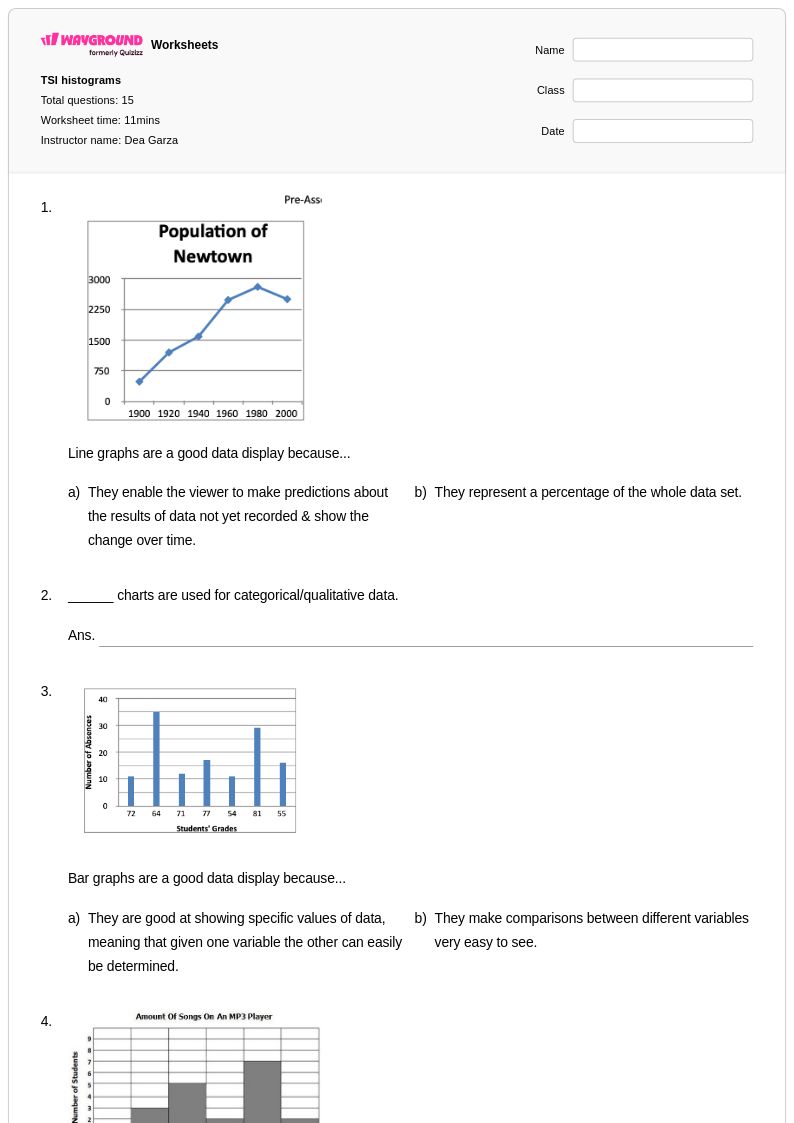
15 Q
9th - 12th
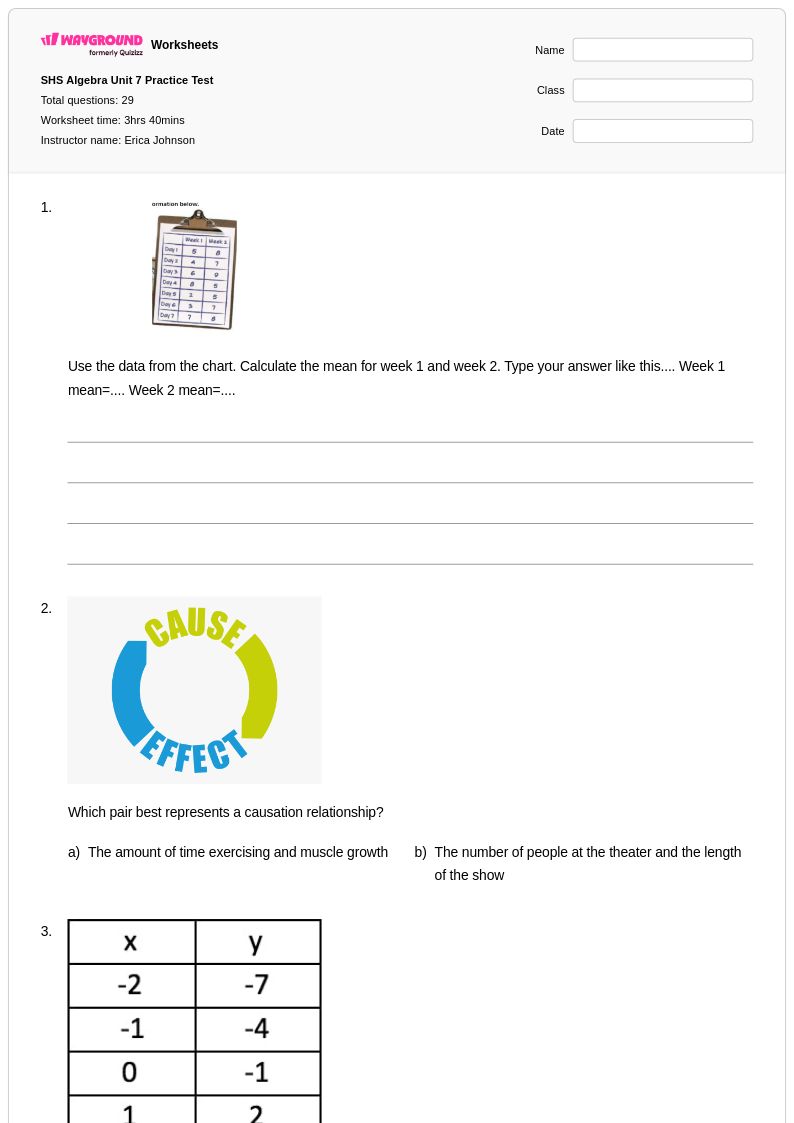
29 Q
9th - 12th
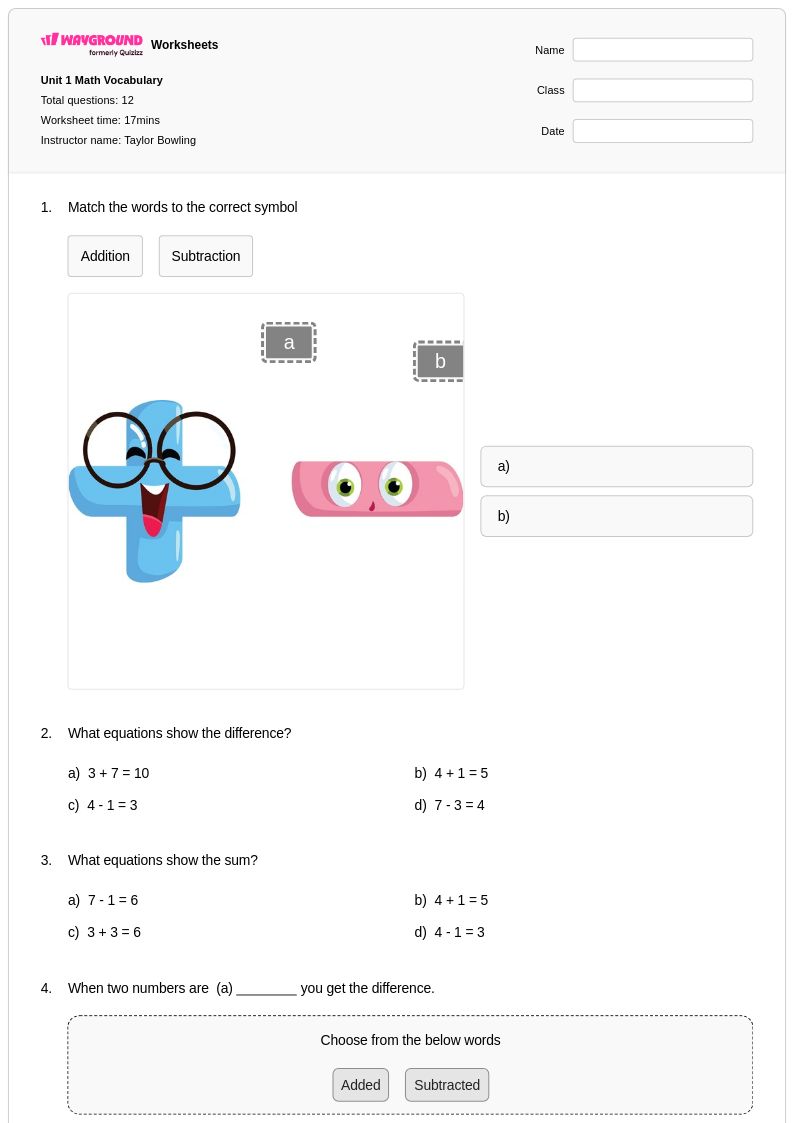
12 Q
1st - Uni
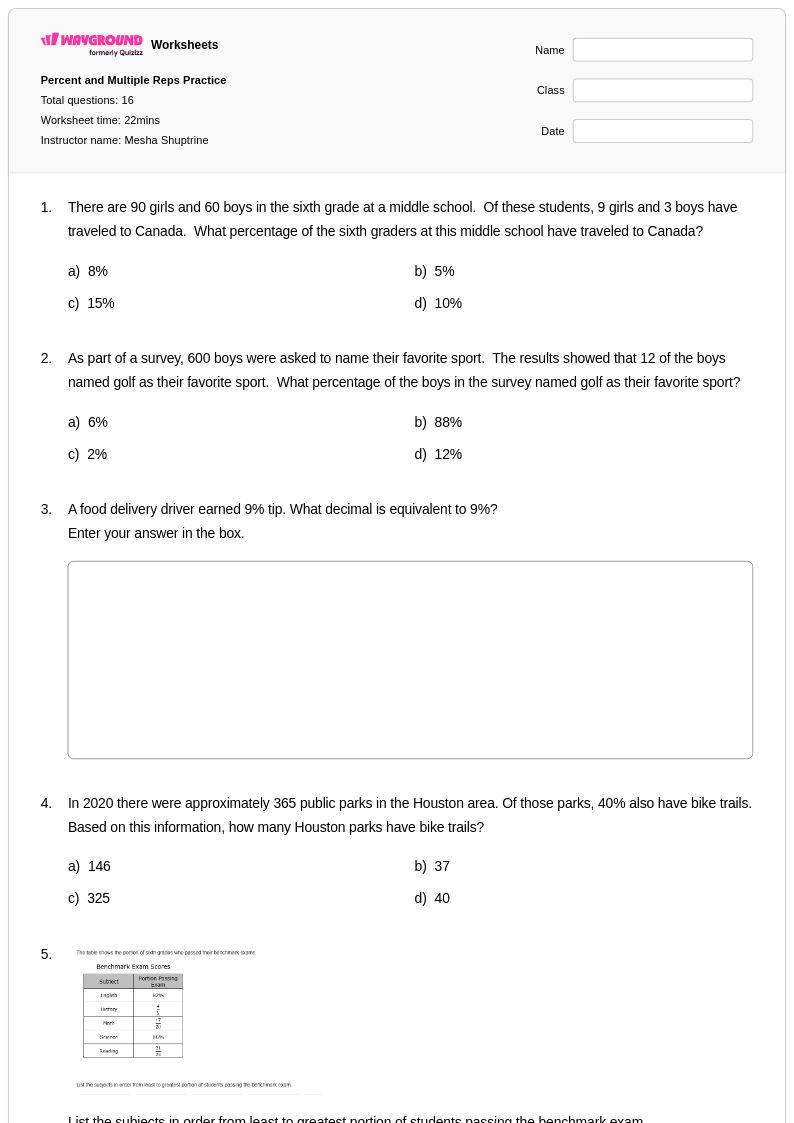
16 Q
6th - Uni
Explore Data Visualization Worksheets by Grades
Explore Other Subject Worksheets for grade 9
Explore printable Data Visualization worksheets for Grade 9
Data visualization worksheets for Grade 9 students available through Wayground (formerly Quizizz) provide comprehensive practice in interpreting, creating, and analyzing various graphical representations of data. These mathematics resources strengthen essential statistical literacy skills including reading and constructing bar graphs, line graphs, histograms, scatter plots, box plots, and pie charts while developing critical thinking about data presentation and interpretation. Students work through practice problems that require them to identify patterns, make predictions, calculate measures of central tendency from visual displays, and determine the most appropriate graph type for different data sets. Each worksheet collection includes detailed answer keys and is available as free printables in convenient pdf format, allowing educators to seamlessly integrate visual data analysis into their probability and statistics curriculum.
Wayground (formerly Quizizz) supports mathematics educators with an extensive library of millions of teacher-created data visualization resources specifically designed for Grade 9 learners. The platform's advanced search and filtering capabilities enable teachers to quickly locate worksheets that align with specific learning standards and match their students' skill levels, while differentiation tools allow for seamless customization of content difficulty and complexity. These flexible resources are available in both printable pdf formats and interactive digital versions, making them ideal for varied instructional settings and learning preferences. Teachers utilize these comprehensive worksheet collections for lesson planning, targeted skill practice, remediation support for struggling students, and enrichment activities for advanced learners, ensuring that all students develop strong competencies in interpreting and creating effective data visualizations.