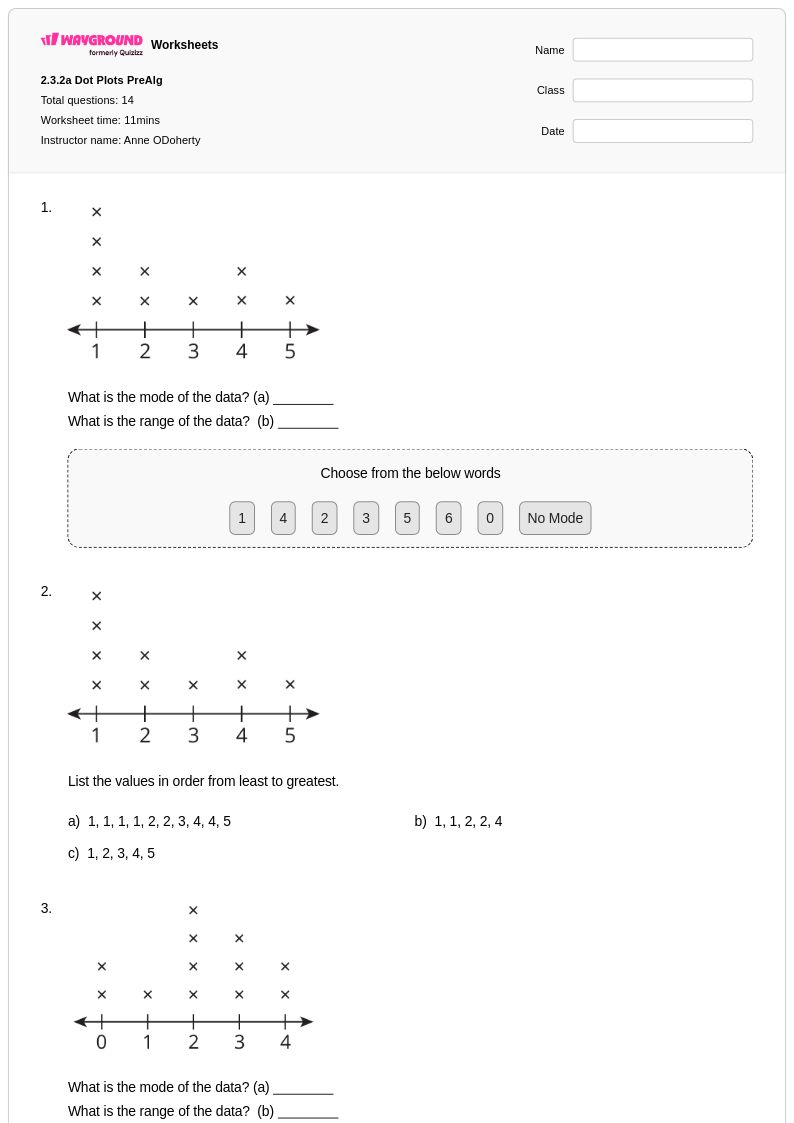
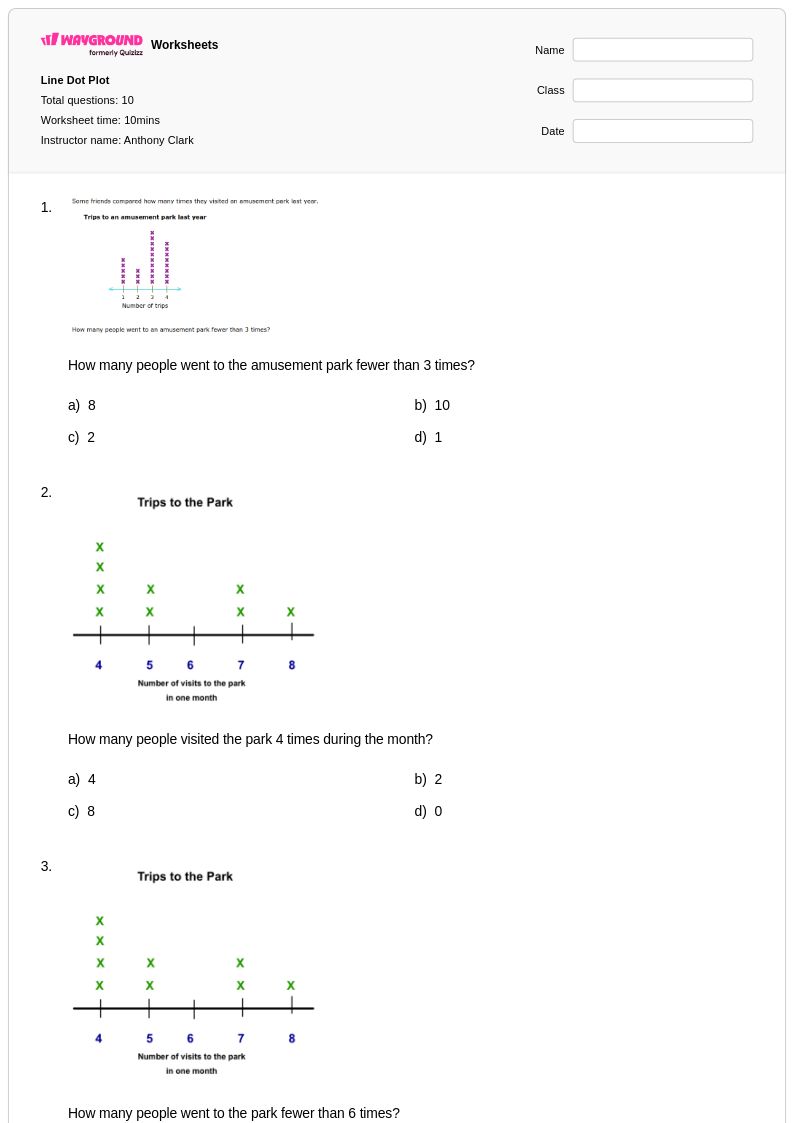
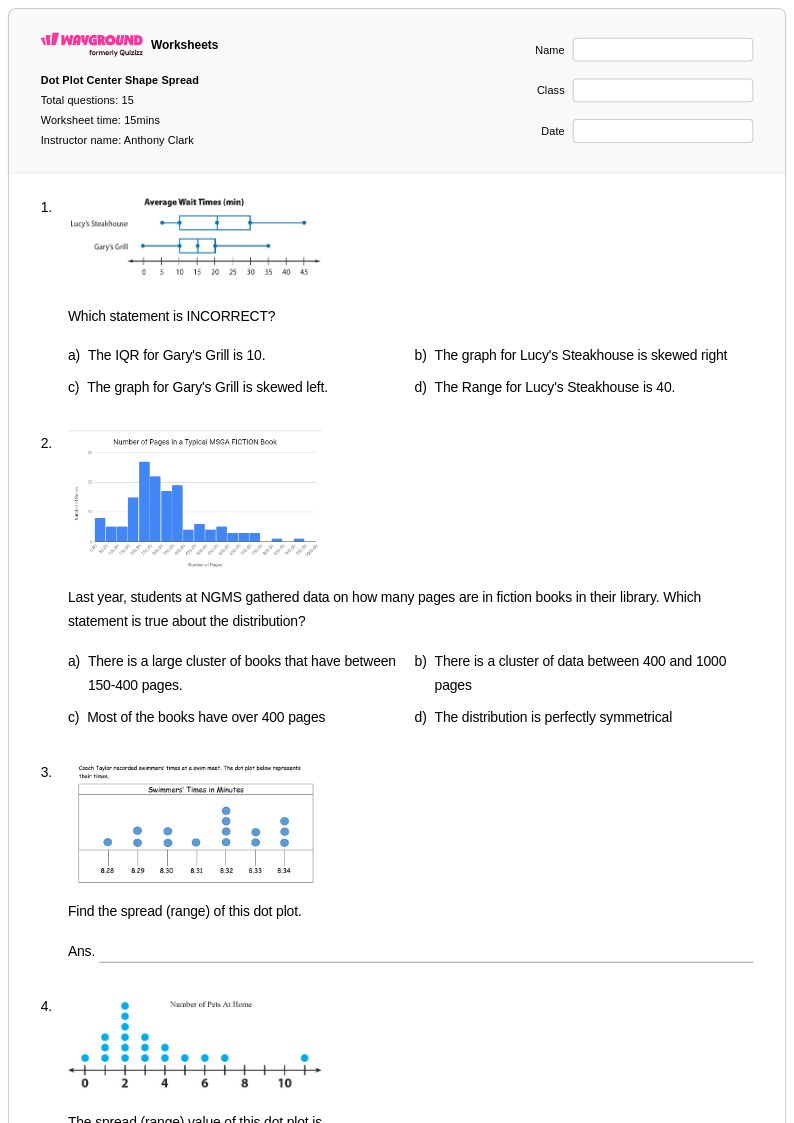
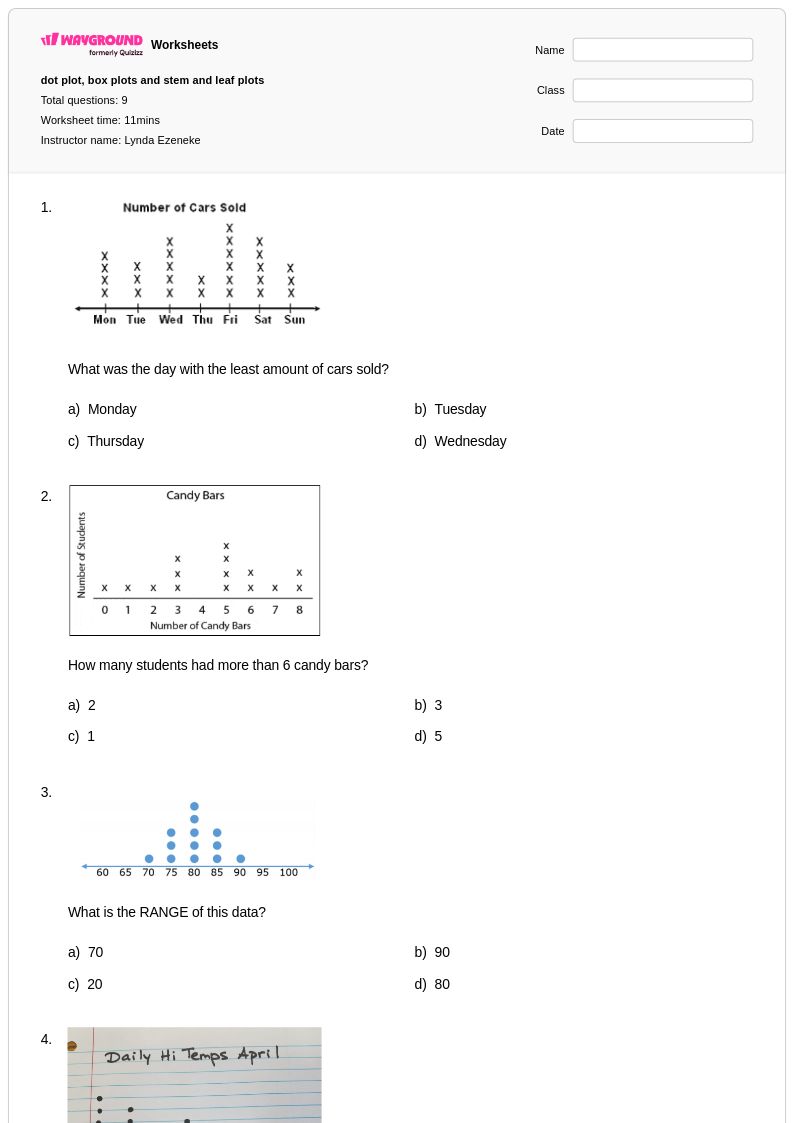
Grade 6 dot plot worksheets from Wayground help students master data visualization through engaging printables and practice problems, complete with answer keys for effective learning.
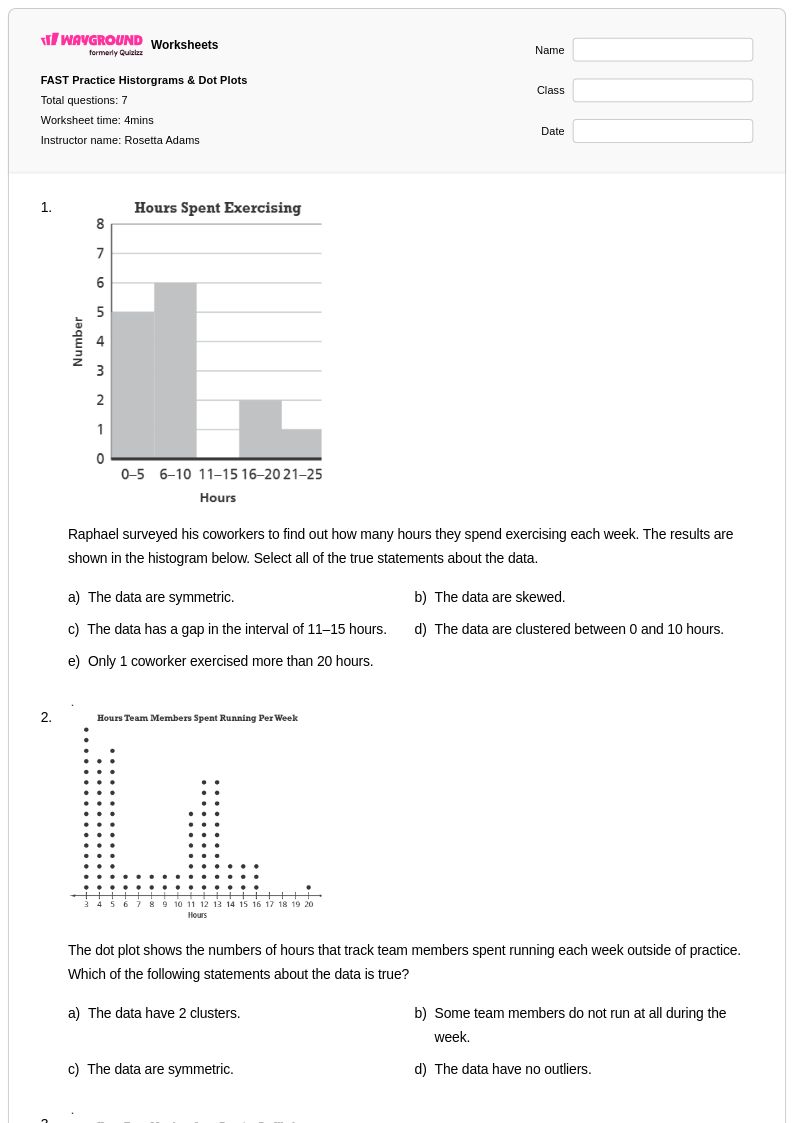
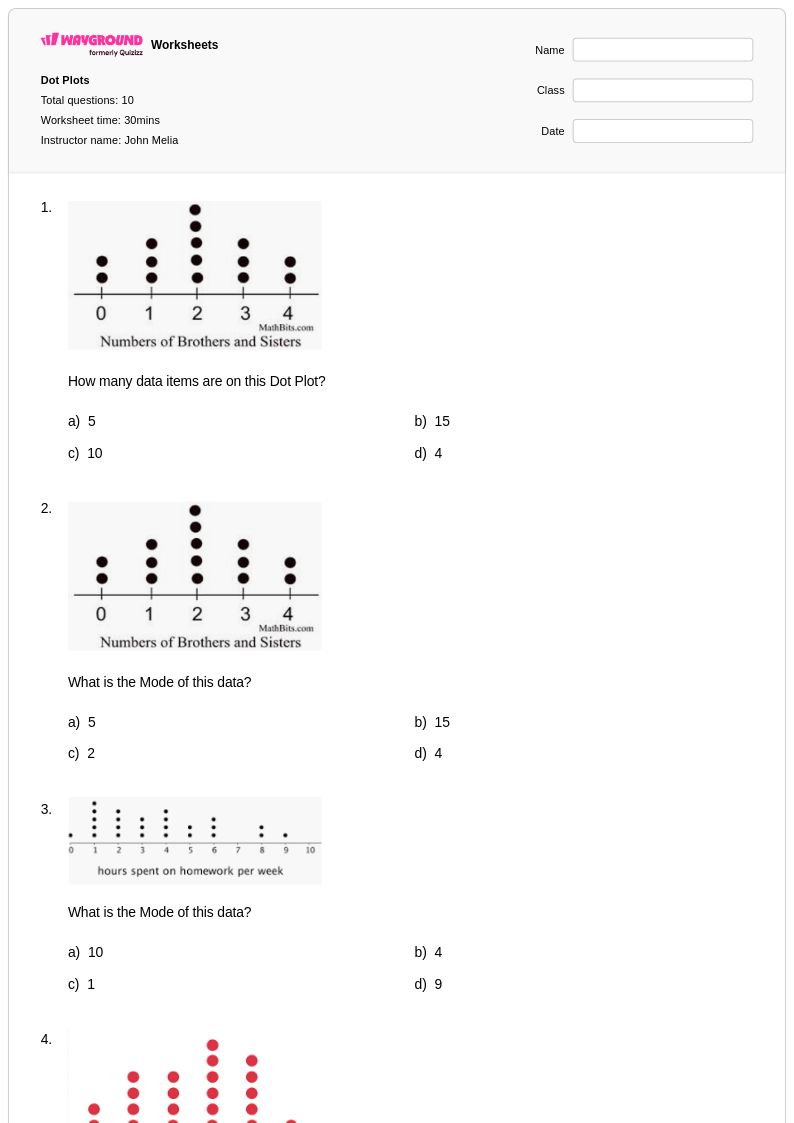
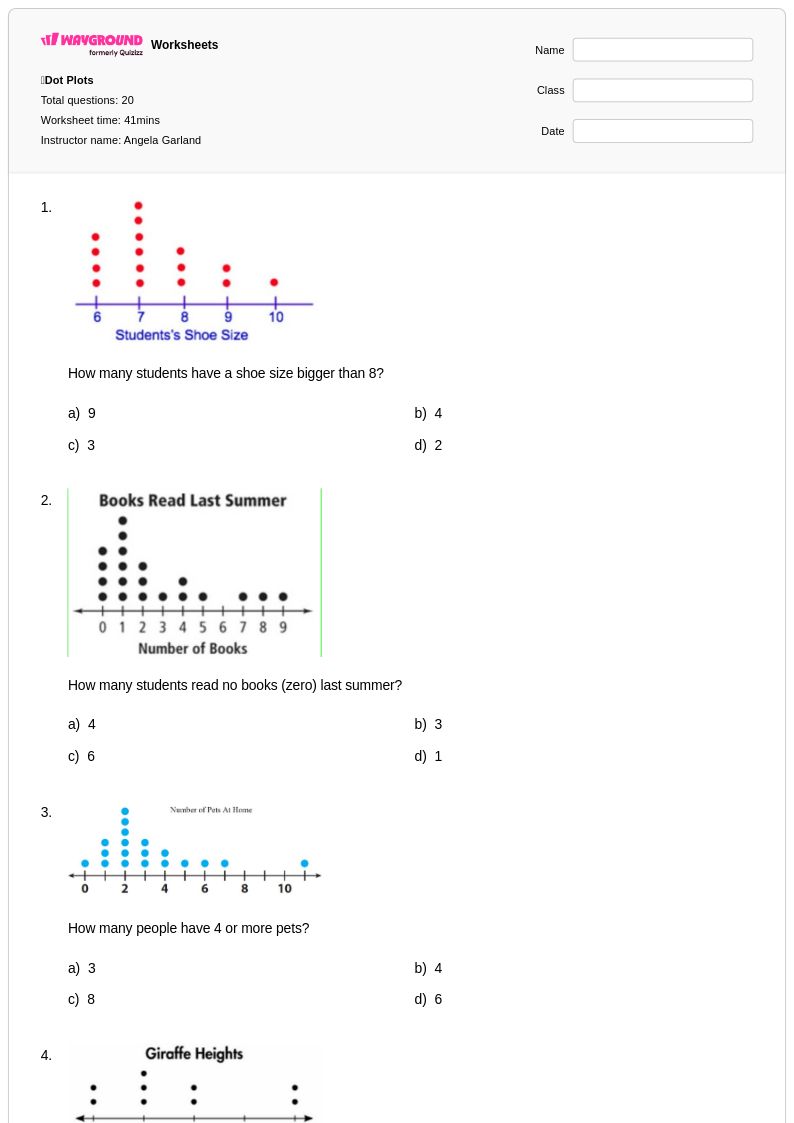
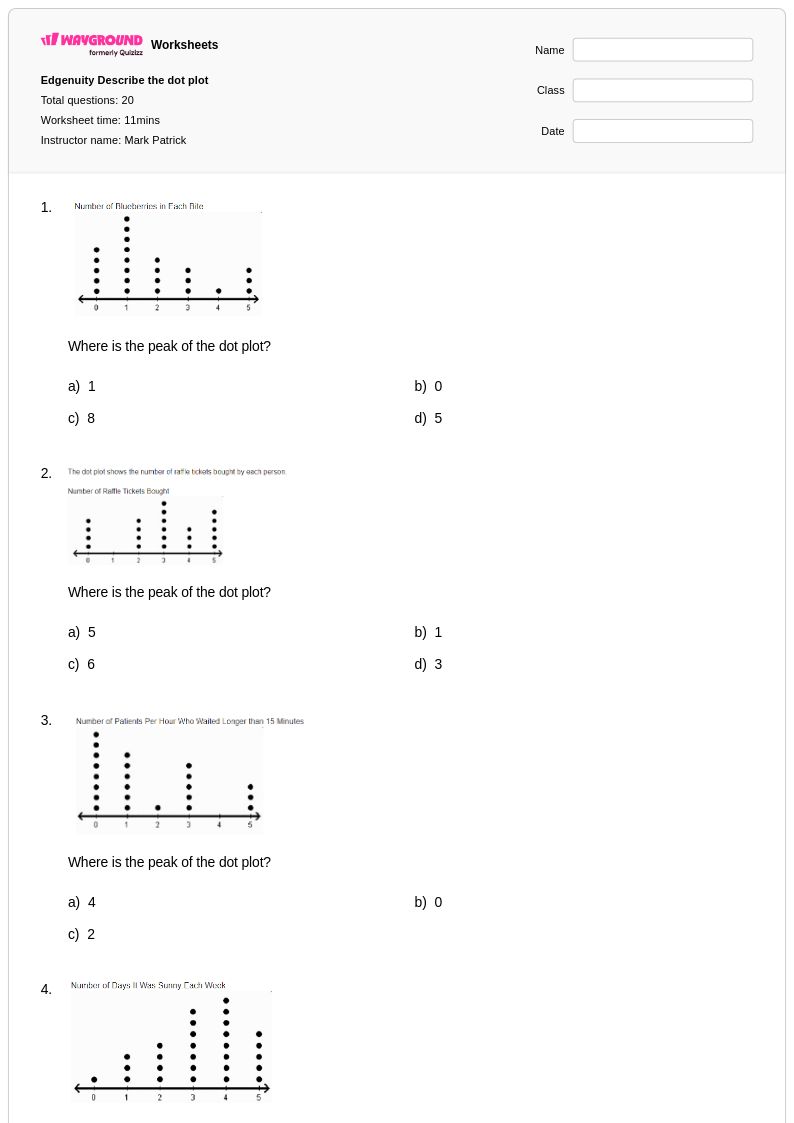
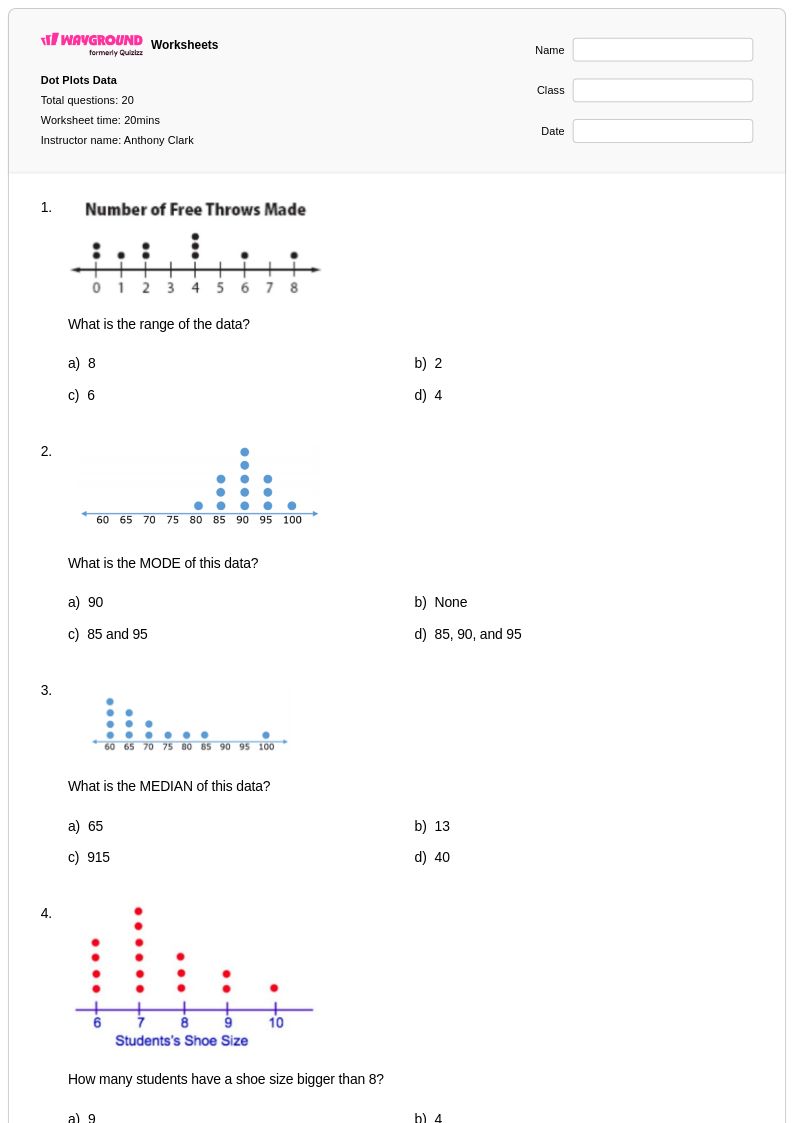
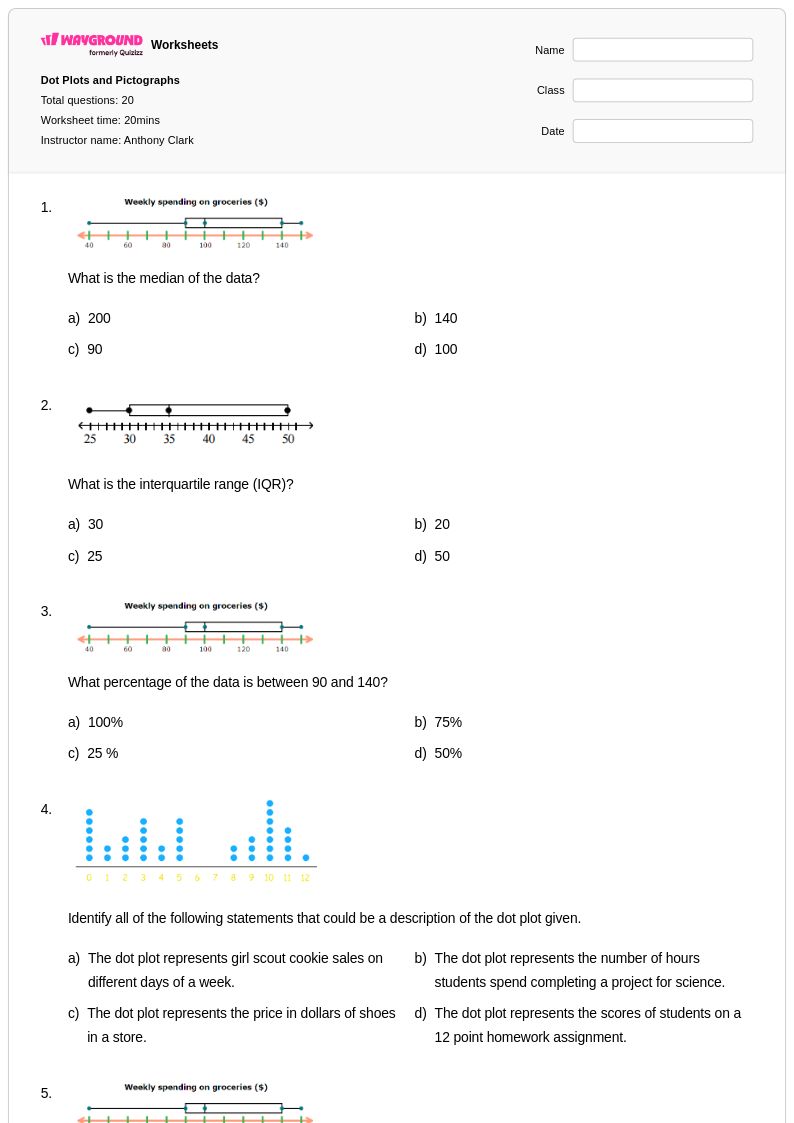
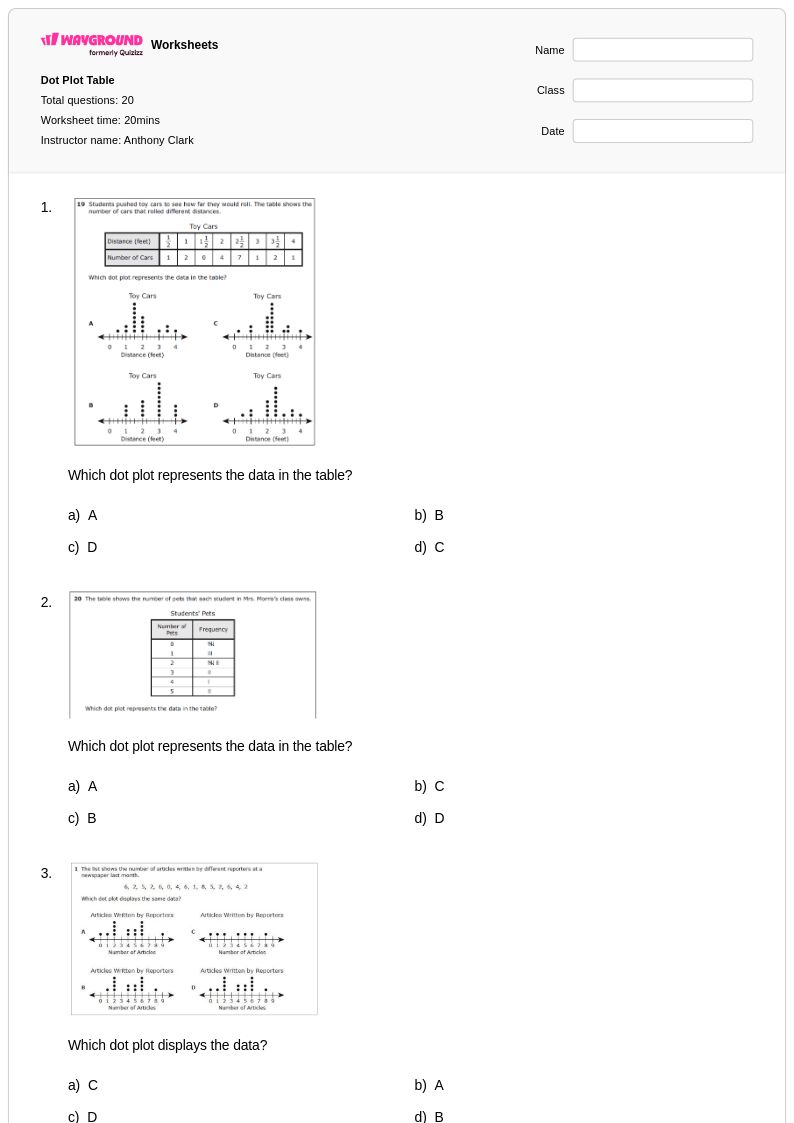
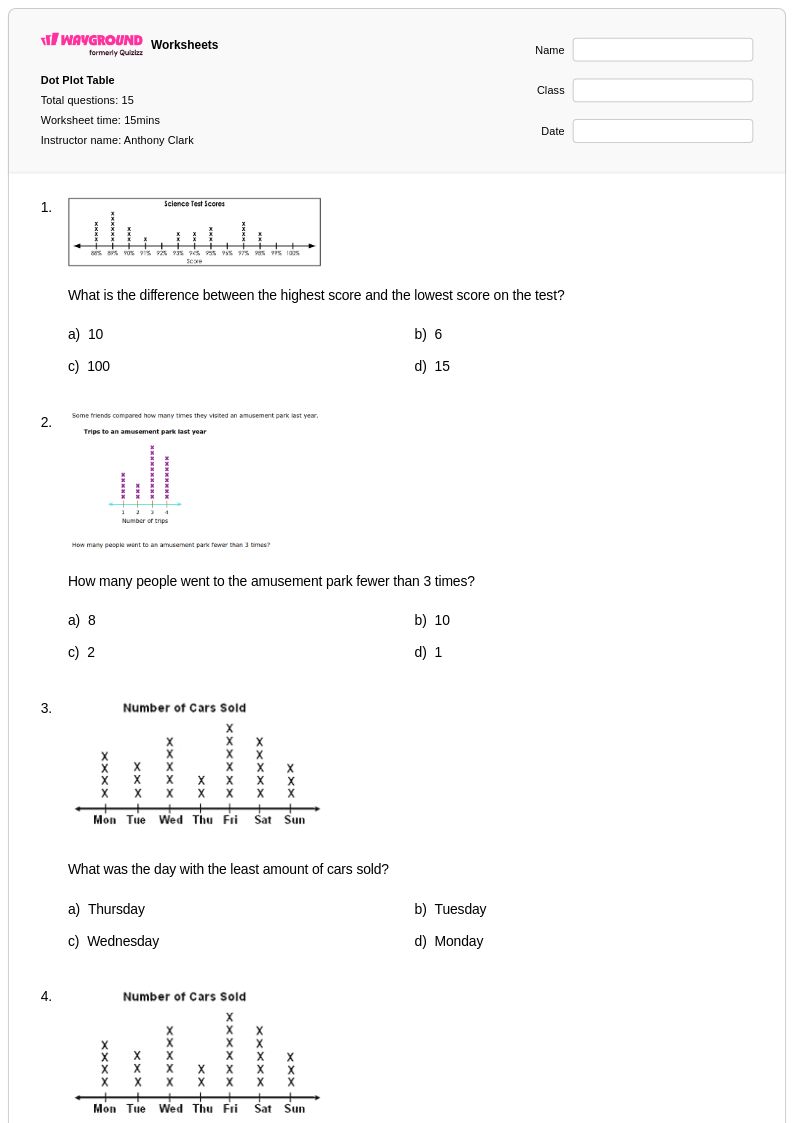
Dot plot worksheets for Grade 6 students available through Wayground (formerly Quizizz) provide comprehensive practice in creating, reading, and interpreting this essential data visualization tool. These carefully designed resources help students master the fundamental skills of organizing numerical data into visual displays, identifying clusters and gaps in data sets, and drawing meaningful conclusions from dot plot representations. The worksheet collection includes diverse practice problems that challenge students to construct dot plots from raw data, analyze existing plots to answer questions about distribution and frequency, and compare multiple data sets using dot plot formats. Each worksheet comes with a complete answer key, making them valuable resources for both independent student practice and teacher-guided instruction, with free printable pdf options ensuring easy classroom implementation.
Wayground (formerly Quizizz) supports educators with millions of teacher-created dot plot resources that streamline lesson planning and enhance Grade 6 mathematics instruction. The platform's robust search and filtering capabilities allow teachers to quickly locate worksheets aligned with specific curriculum standards and learning objectives, while built-in differentiation tools enable customization based on individual student needs and skill levels. These comprehensive worksheet collections are available in both printable and digital formats, including downloadable pdf versions that facilitate seamless integration into existing classroom routines. Teachers can leverage these resources for targeted skill practice, remediation support for struggling learners, and enrichment opportunities for advanced students, with the flexibility to modify content and create personalized learning experiences that address diverse mathematical abilities within the Grade 6 classroom.
FAQs
How do I teach dot plots to sixth graders?
By Grade 6, dot plots are a statistics tool, not just a graphing exercise. Frame instruction around what dot plots reveal that a table of numbers doesn't: the shape of the distribution, where data clusters, and how spread out values are. Introduce measures of center (mean, median) and variability (range, MAD) in the context of a dot plot so students can see what those numbers describe visually. Comparing two dot plots side by side — same scale, different datasets — is one of the most effective tasks at this level.
What exercises help sixth graders practice dot plots?
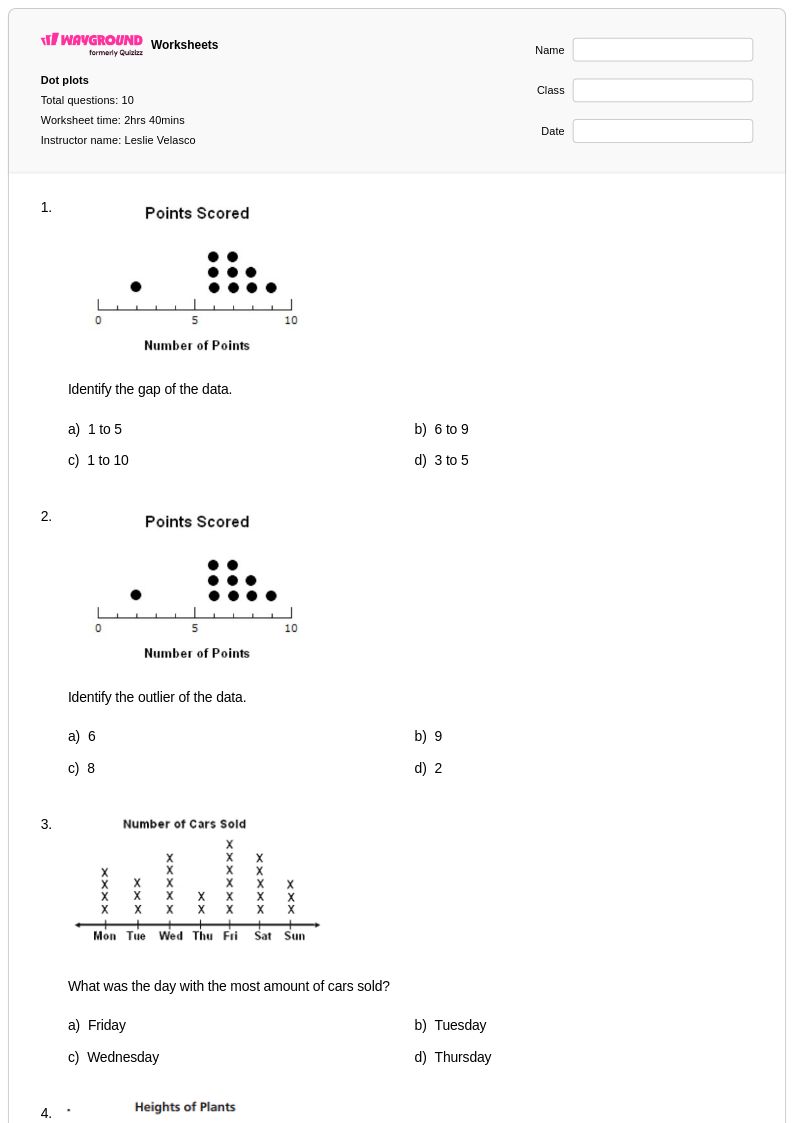
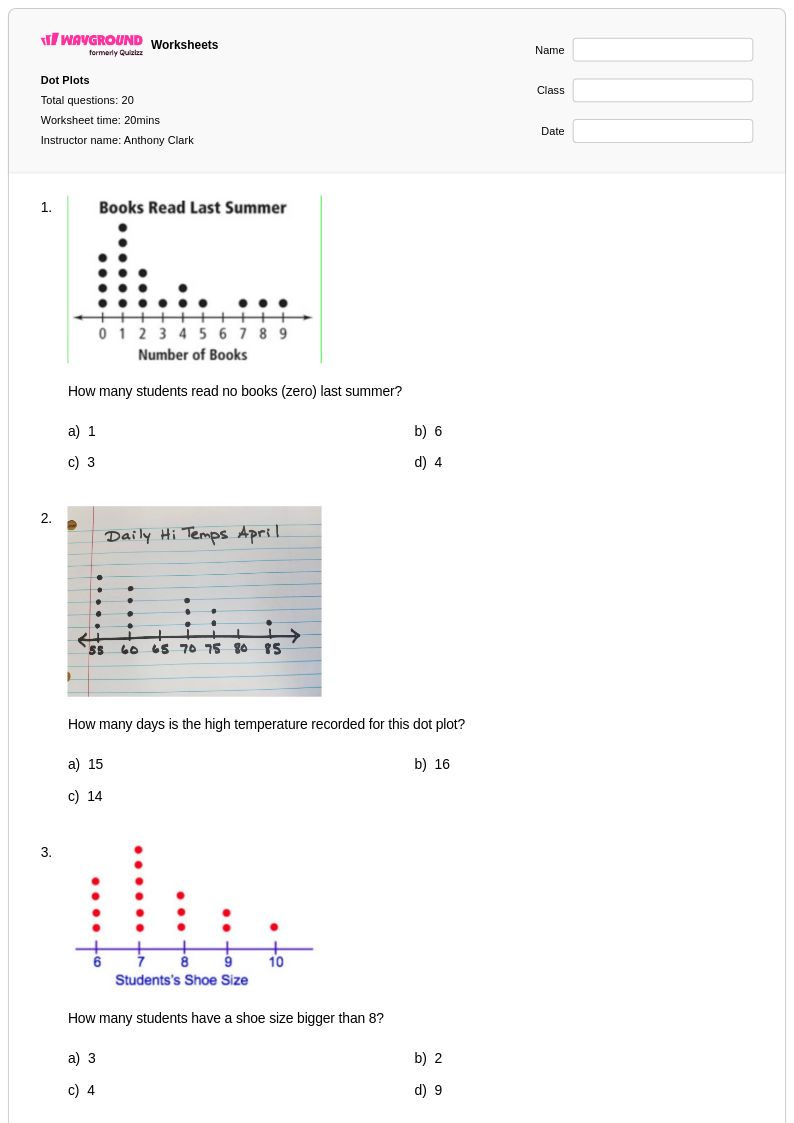
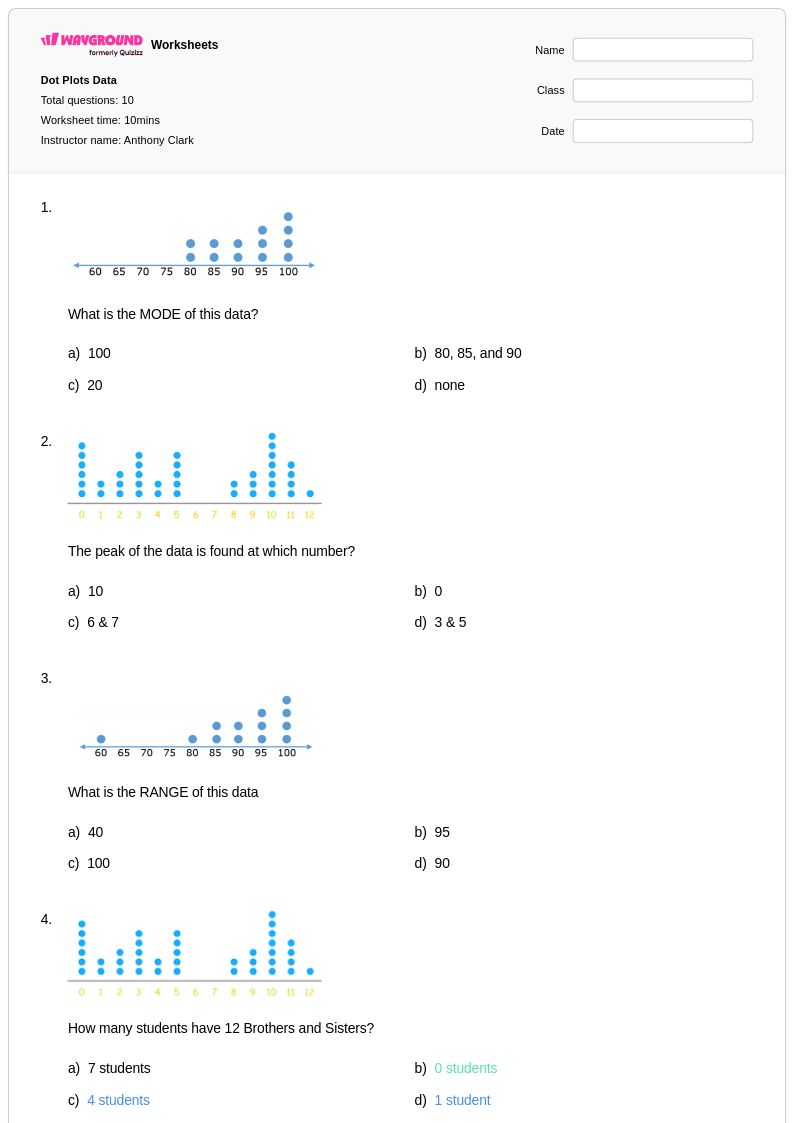
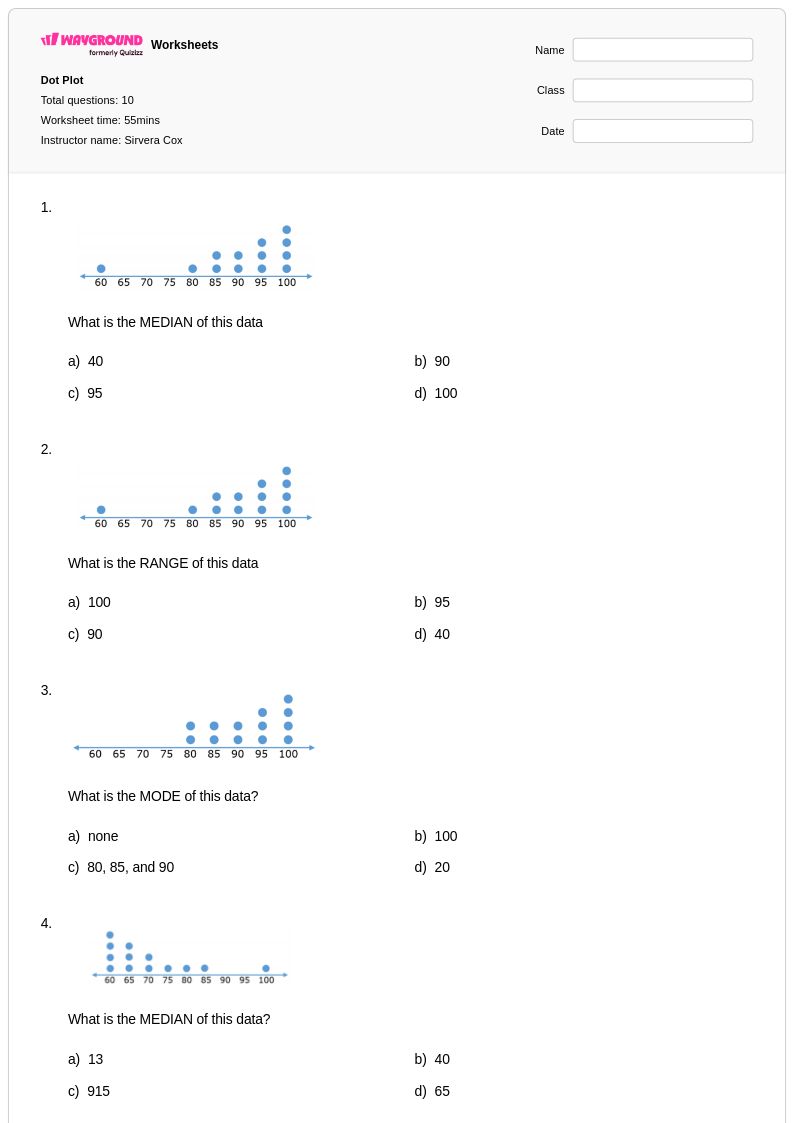
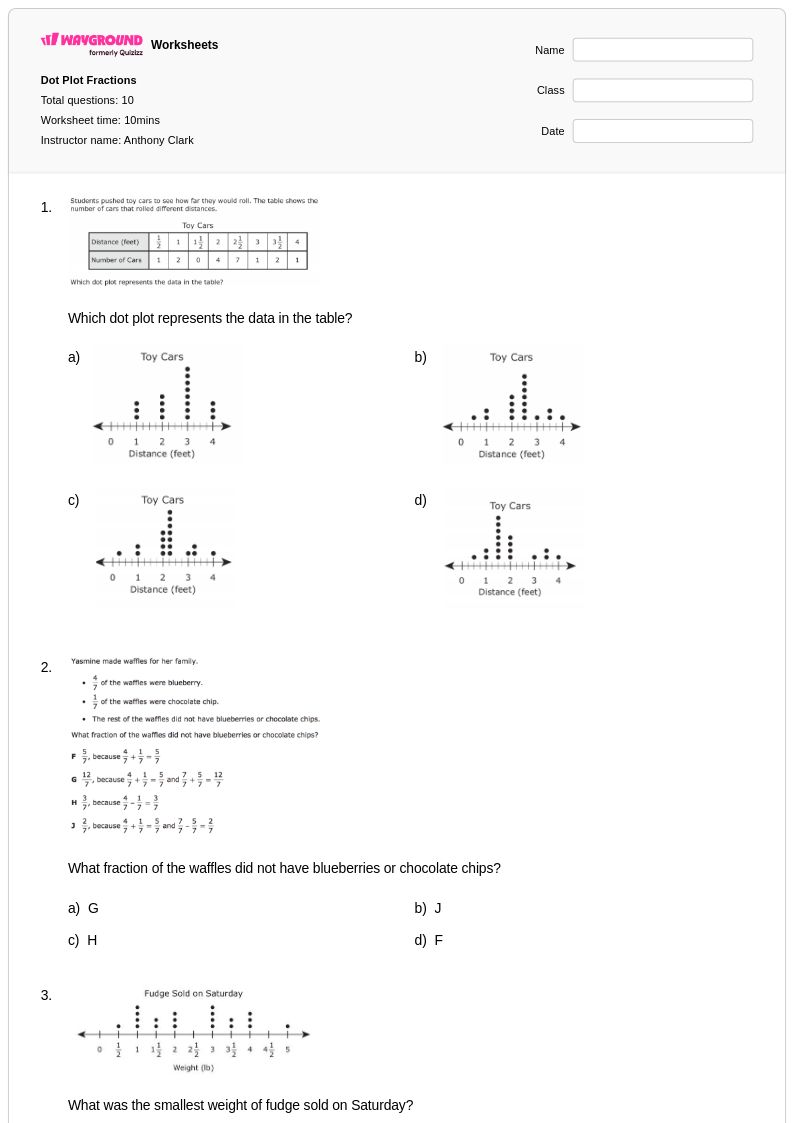
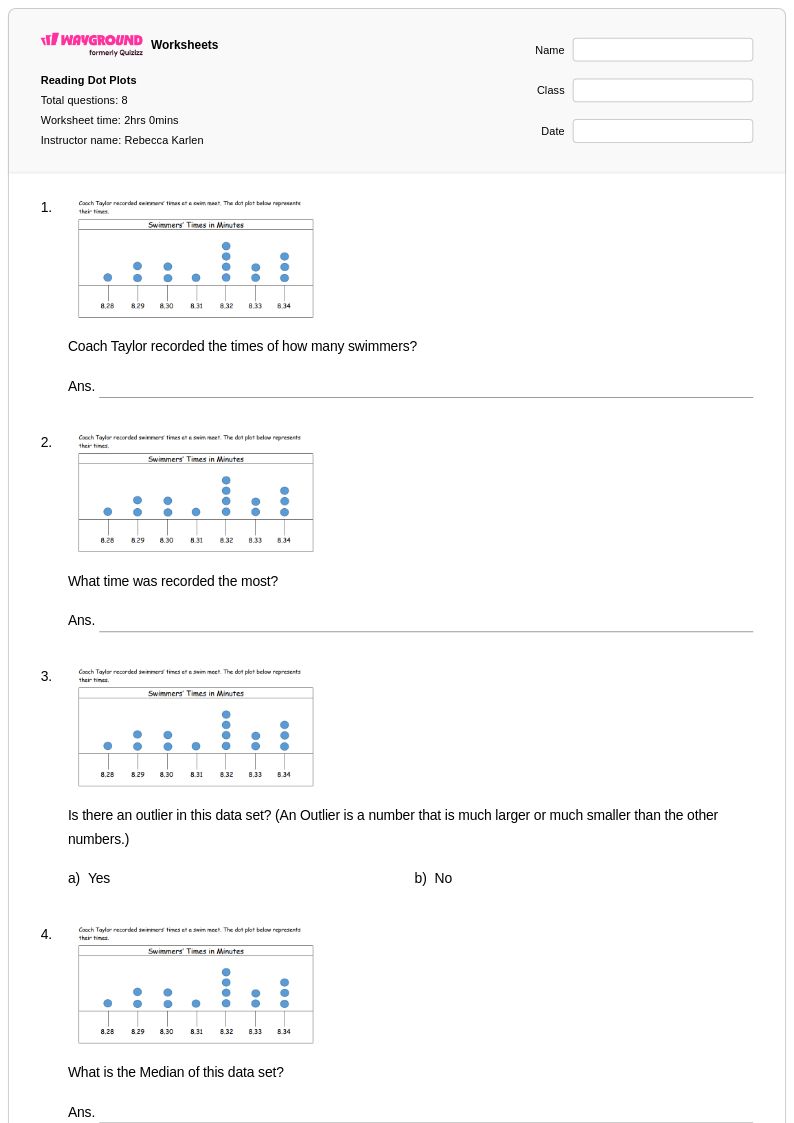
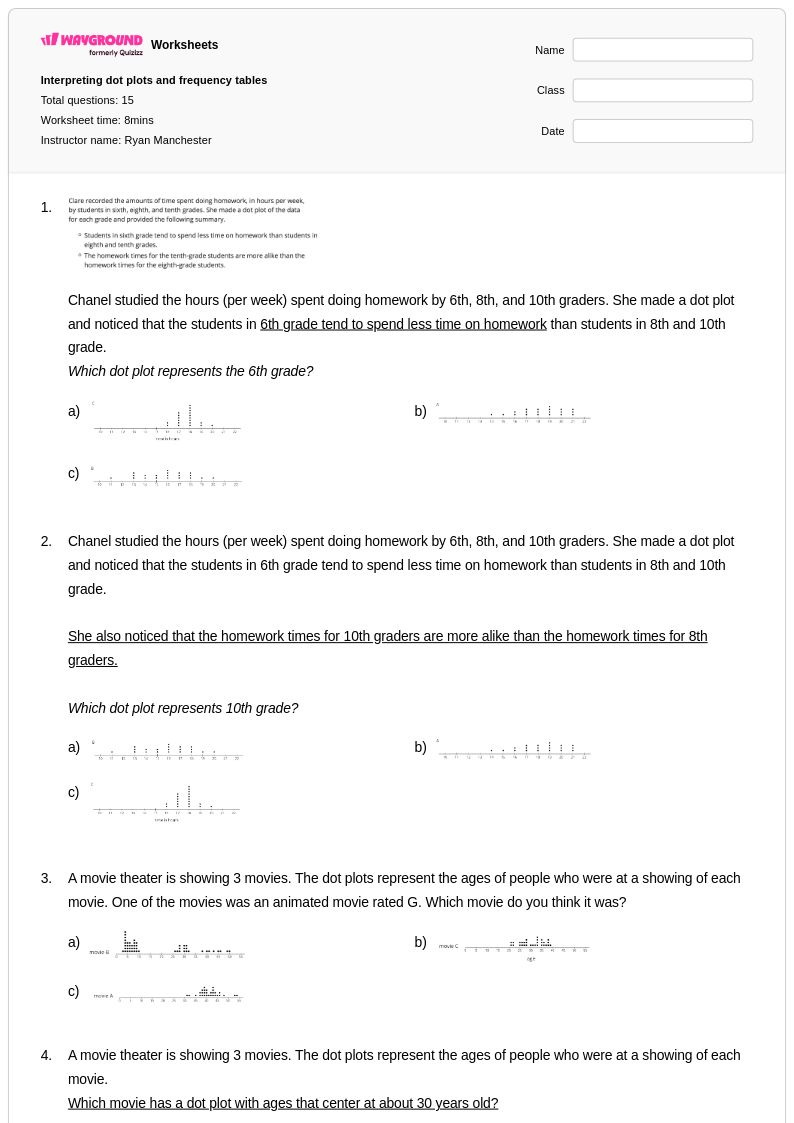
Grade 6 practice should go beyond construction. Strong exercises include: identifying clusters, gaps, and outliers in a given plot; calculating the mean and median and locating them on the dot plot; and comparing two distributions using both visual inspection and numerical measures. Wayground's Grade 6 worksheets include multi-part problems that connect the visual display to statistical calculations, which is exactly the integration this grade level requires.
What mistakes do sixth graders commonly make with dot plots?
The most persistent error is treating the mean as always the best descriptor of center — students calculate it correctly but don't recognize when an outlier pulls it away from where most data actually sits. They also struggle to describe distribution shape in words; they can see a cluster but don't know how to articulate what it means. A useful habit: require students to write one sentence describing the distribution before answering any calculation questions.
How do I use Wayground's Grade 6 dot plot worksheets?
Each worksheet is available as a printable PDF with a complete answer key, or you can host it as a digital quiz on Wayground. For paper submissions, the Wayground for Teachers app lets you scan and grade student work without manual re-entry — useful when you're running dot plot practice alongside other data units and grading volume is high. The digital format gives you per-question class results immediately after students submit.
Are Grade 6 dot plot worksheets aligned to Common Core?
Common Core's Grade 6 statistics standards place dot plots at the center of a larger unit on distributions. Students are expected to use dot plots, histograms, and box plots to describe the shape of a distribution and summarize it with measures of center and variability. Dot plots are the entry point because individual data points remain visible — making it easier to connect the visual to the mean absolute deviation calculation that Grade 6 introduces for the first time.
How can I differentiate Grade 6 dot plot practice for mixed-ability classes?
For students who need scaffolding on the statistical vocabulary (cluster, gap, outlier, spread), Wayground's Read Aloud accommodation ensures question prompts are accessible even when the language is dense. For students ready to go deeper, look for worksheets that ask them to compare two distributions and justify which measure of center better represents each — that level of reasoning goes well beyond the standard and stretches advanced learners without requiring a separate assignment.