
10 Q
2nd - 3rd
12 Q
2nd
10 Q
2nd - 3rd
12 Q
2nd
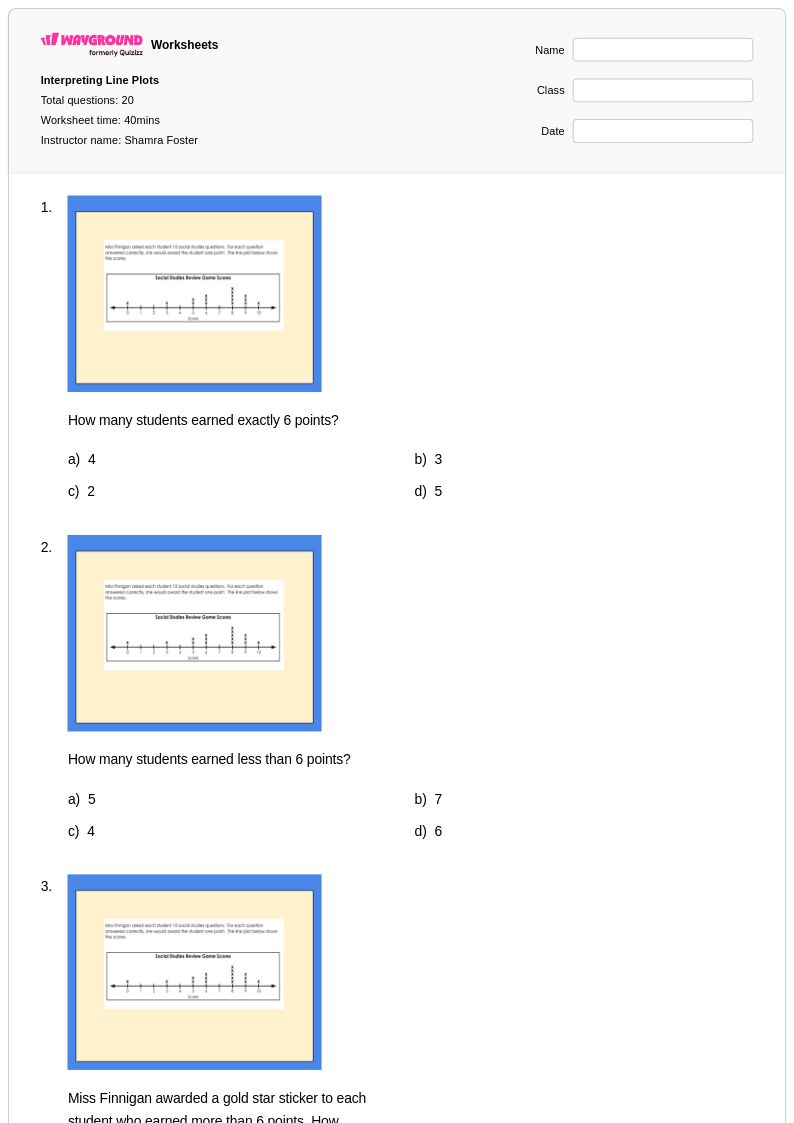
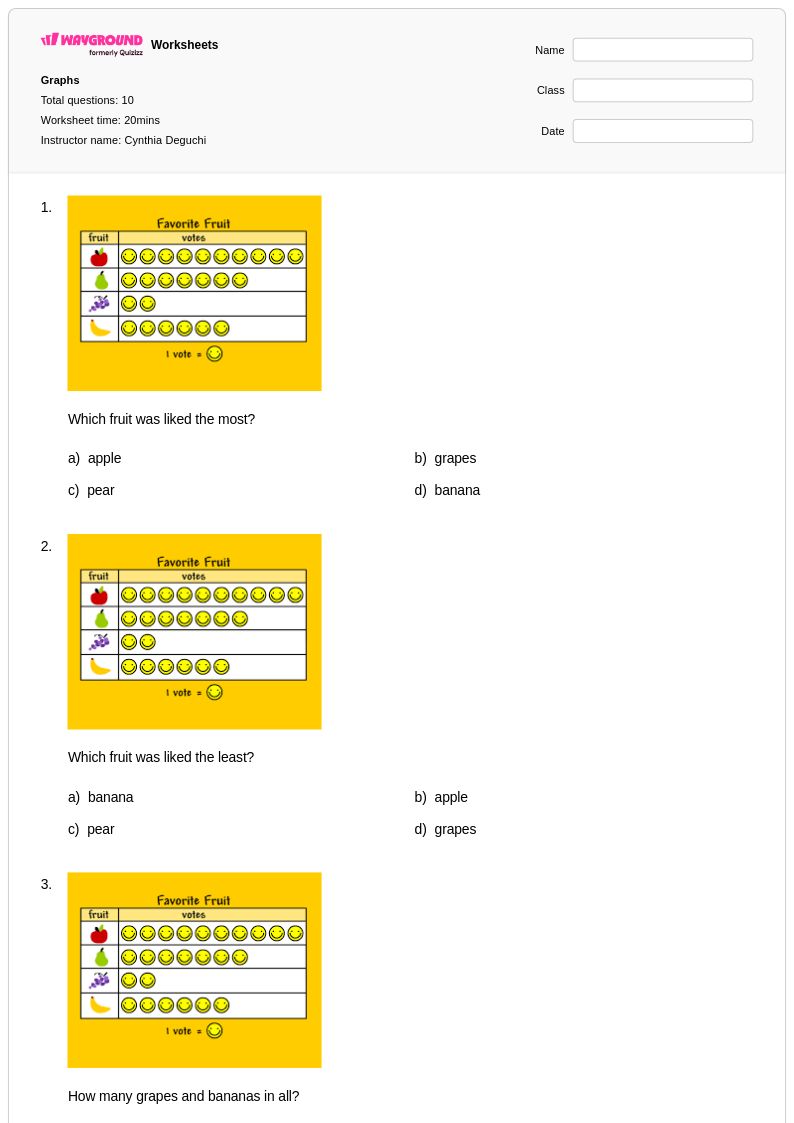
20 Q
2nd
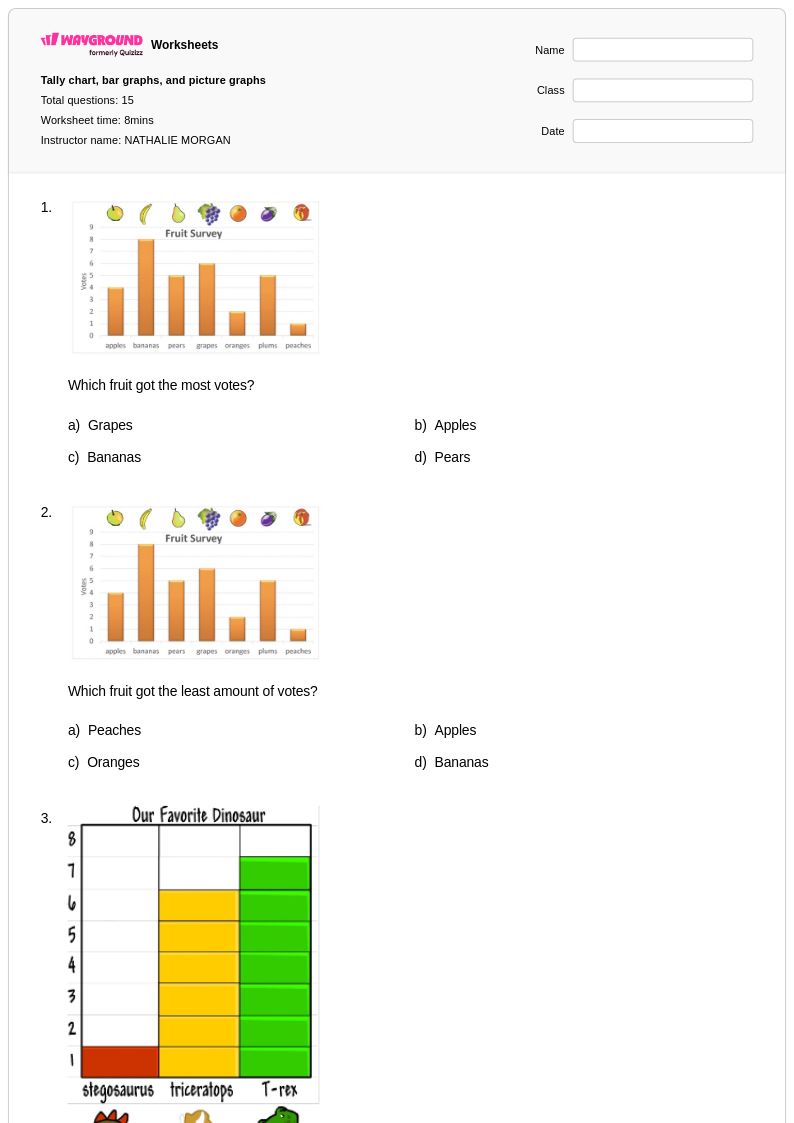
15 Q
2nd
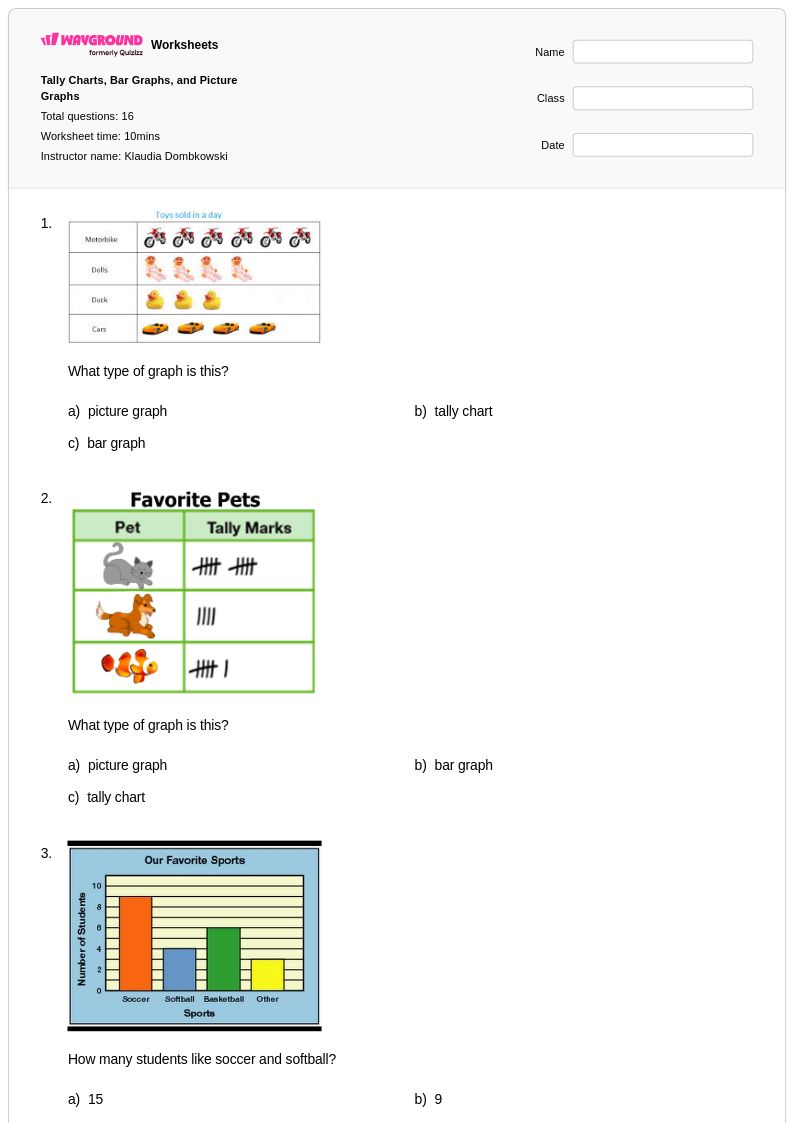
16 Q
2nd
10 Q
1st - 2nd
11 Q
2nd - 5th

15 Q
2nd - 3rd
14 Q
2nd
10 Q
1st - 2nd
10 Q
2nd
10 Q
2nd - 3rd
15 Q
2nd
10 Q
2nd
10 Q
2nd - 3rd
10 Q
2nd
10 Q
2nd - 3rd
16 Q
2nd
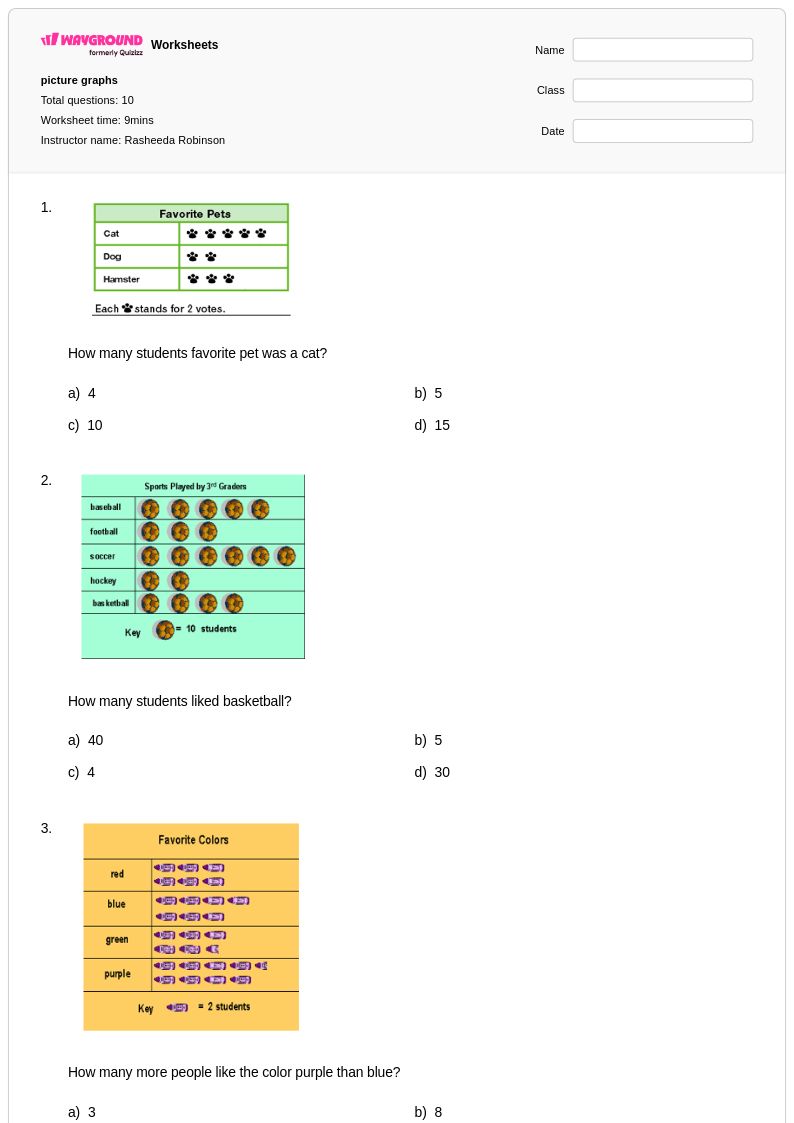
9 Q
2nd - 5th
10 Q
2nd
15 Q
2nd - 3rd
10 Q
2nd - 3rd
Explore Interpreting Graphs Worksheets by Grades
Explore Other Subject Worksheets for grade 2
Explore printable Interpreting Graphs worksheets for Grade 2
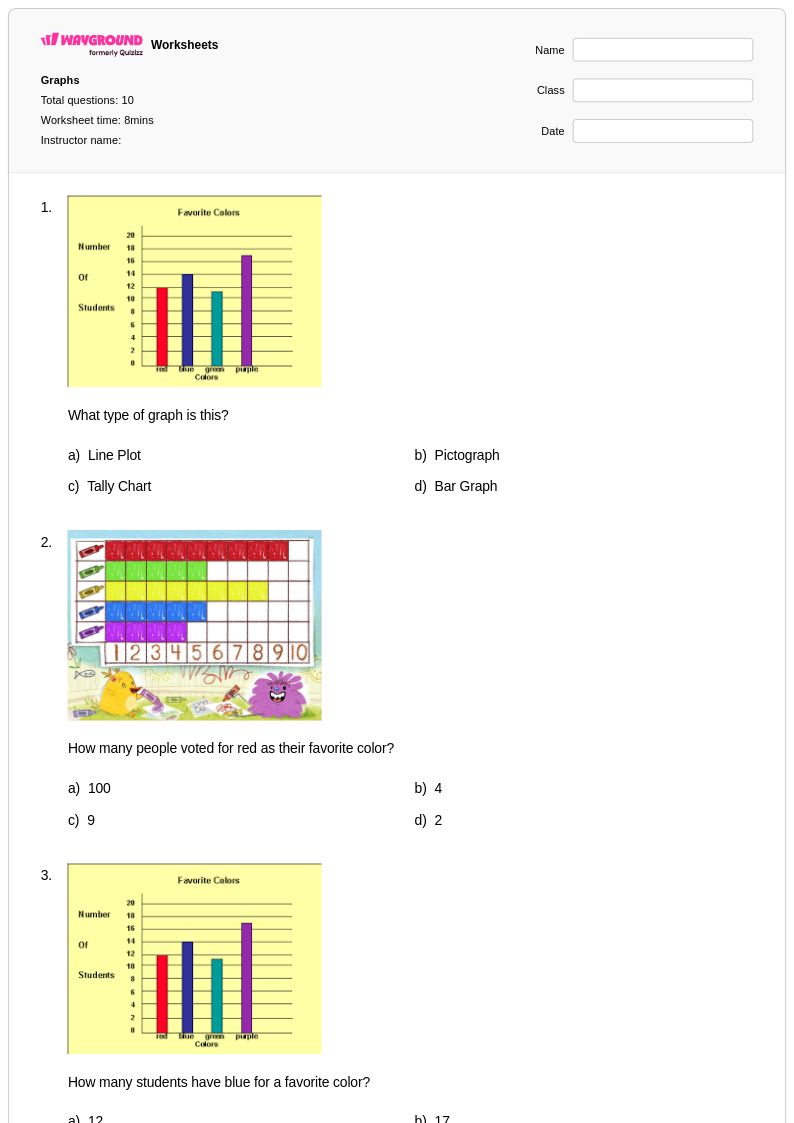
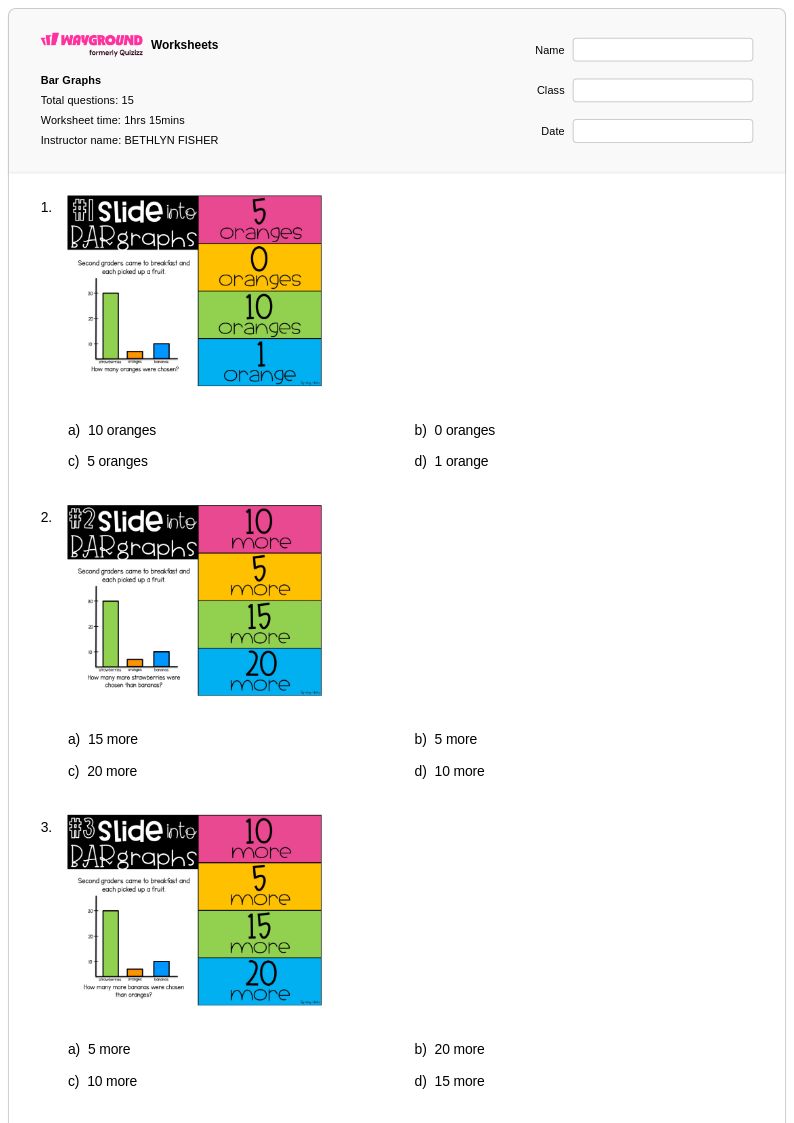
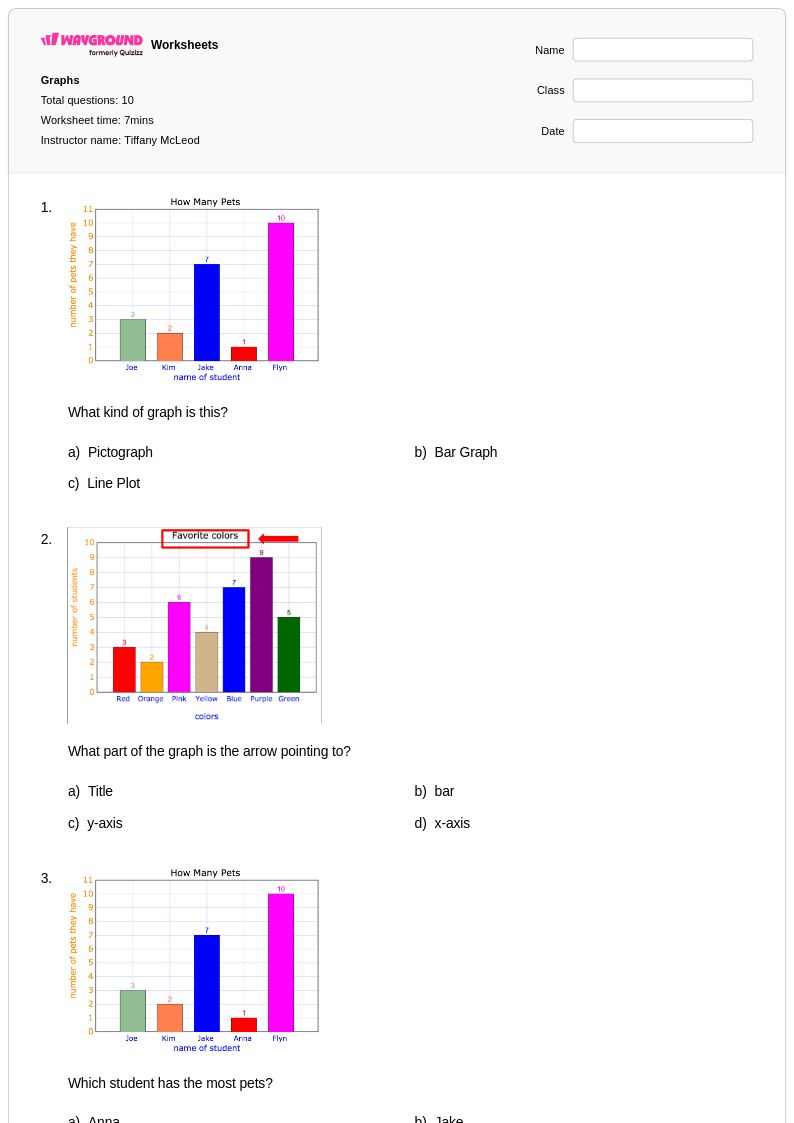
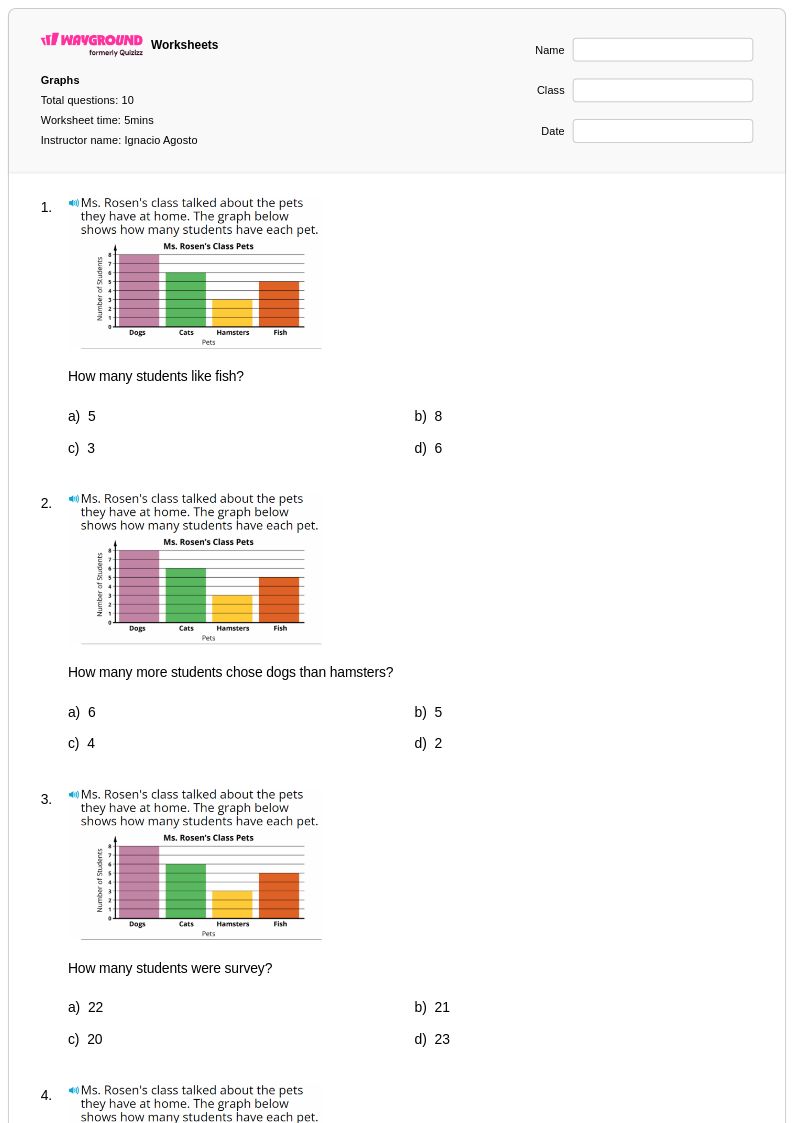
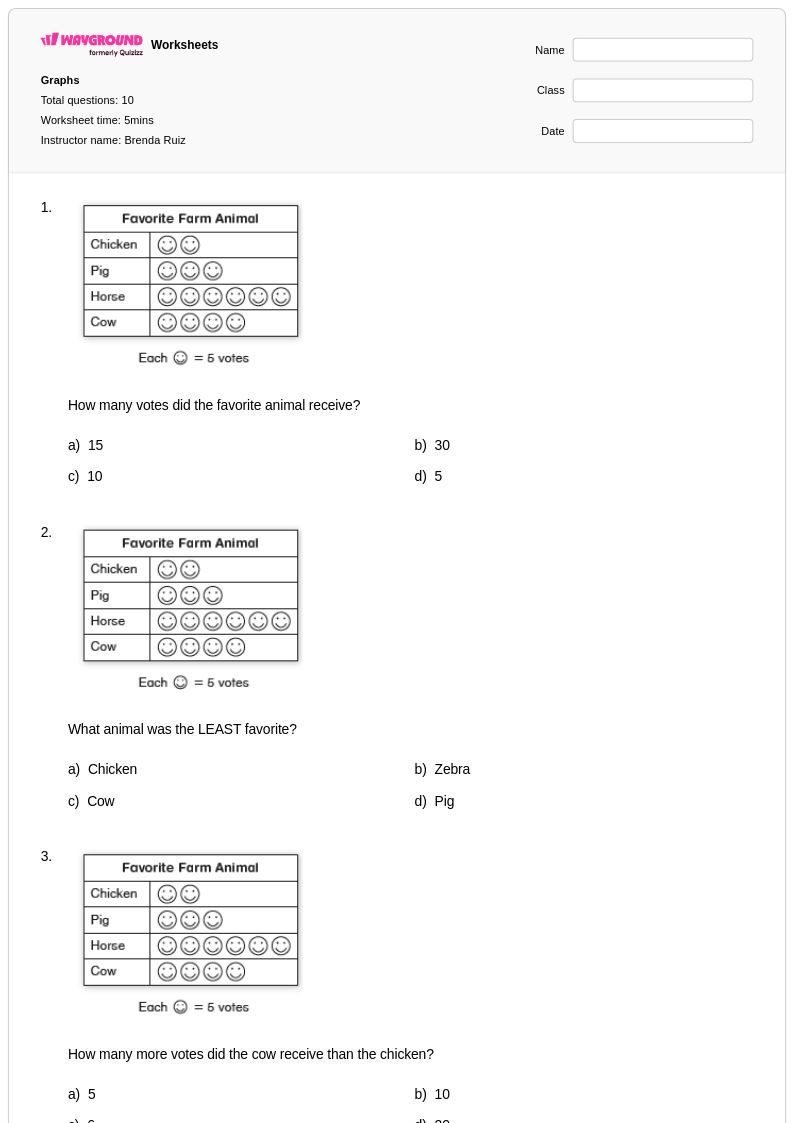
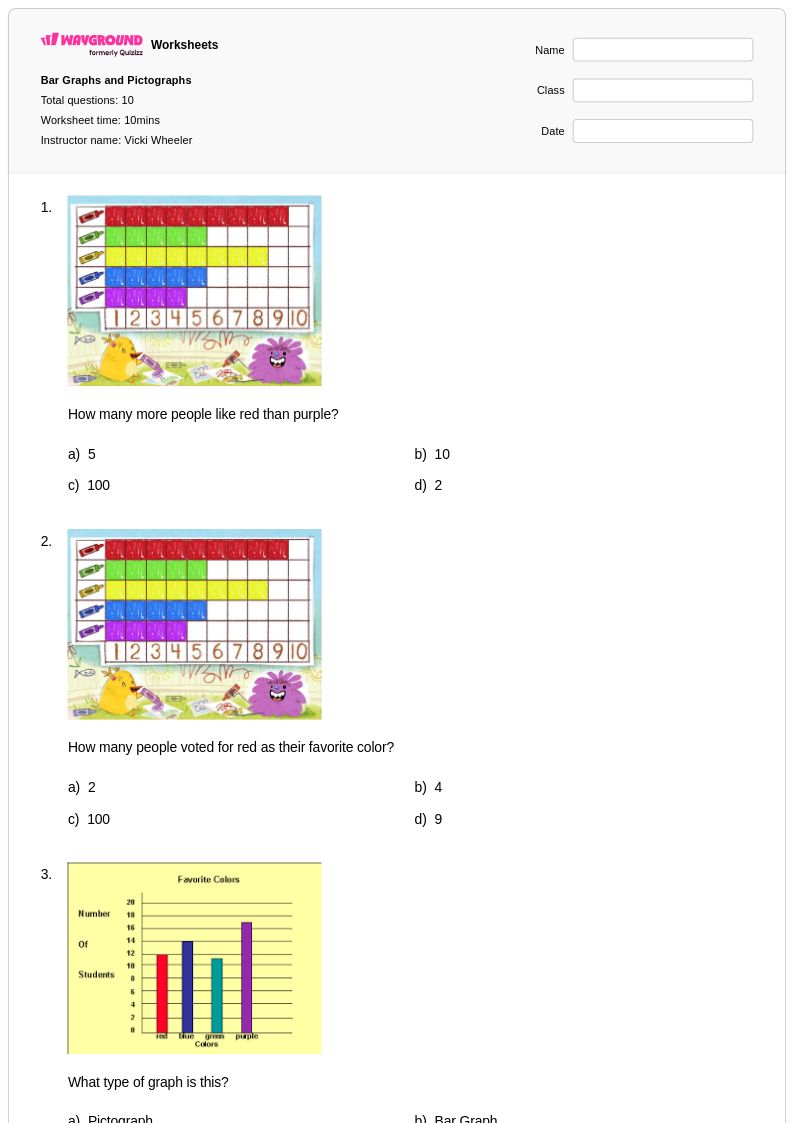
Interpreting graphs in Grade 2 mathematics represents a fundamental skill that bridges visual literacy with mathematical understanding, and Wayground's comprehensive worksheet collection provides educators with expertly designed resources to develop these critical abilities. These worksheets focus on helping young learners read and analyze simple bar graphs, pictographs, and tally charts by asking targeted questions about data representation, comparing quantities, and drawing basic conclusions from visual information. Each practice problem is carefully structured to build confidence in extracting meaning from graphical displays, while the included answer key enables teachers to provide immediate feedback and identify areas where students may need additional support. The free printable format ensures accessibility for all classroom environments, allowing teachers to distribute these valuable learning tools as pdf downloads or physical handouts that reinforce essential data interpretation skills.
Wayground, formerly Quizizz, empowers educators with millions of teacher-created resources specifically designed for interpreting graphs at the Grade 2 level, featuring robust search and filtering capabilities that help instructors quickly locate materials aligned with their curriculum standards and learning objectives. The platform's differentiation tools allow teachers to customize worksheets based on individual student needs, providing both remediation support for struggling learners and enrichment opportunities for advanced students ready to tackle more complex graphing concepts. Available in both printable and digital formats including downloadable pdf versions, these resources seamlessly integrate into lesson planning workflows while supporting flexible implementation across diverse teaching environments. Teachers can efficiently utilize these materials for skill practice sessions, formative assessments, homework assignments, and intervention activities, ensuring that all students develop strong foundational abilities in reading and interpreting visual data representations.