
20 Q
7th
5 Q
3rd
20 Q
6th - Uni
31 Q
6th
17 Q
6th
11 Q
6th - 7th
8 Q
6th
12 Q
9th
19 Q
9th - Uni
26 Q
7th
10 Q
6th
15 Q
5th - 6th
15 Q
7th
20 Q
6th - Uni
34 Q
3rd
20 Q
7th - Uni
14 Q
7th
10 Q
7th
9 Q
7th - Uni
6 Q
7th
10 Q
4th - Uni
21 Q
5th
12 Q
6th

12 Q
4th - Uni
Explore Worksheets by Subjects
Explore printable Dot Plot worksheets
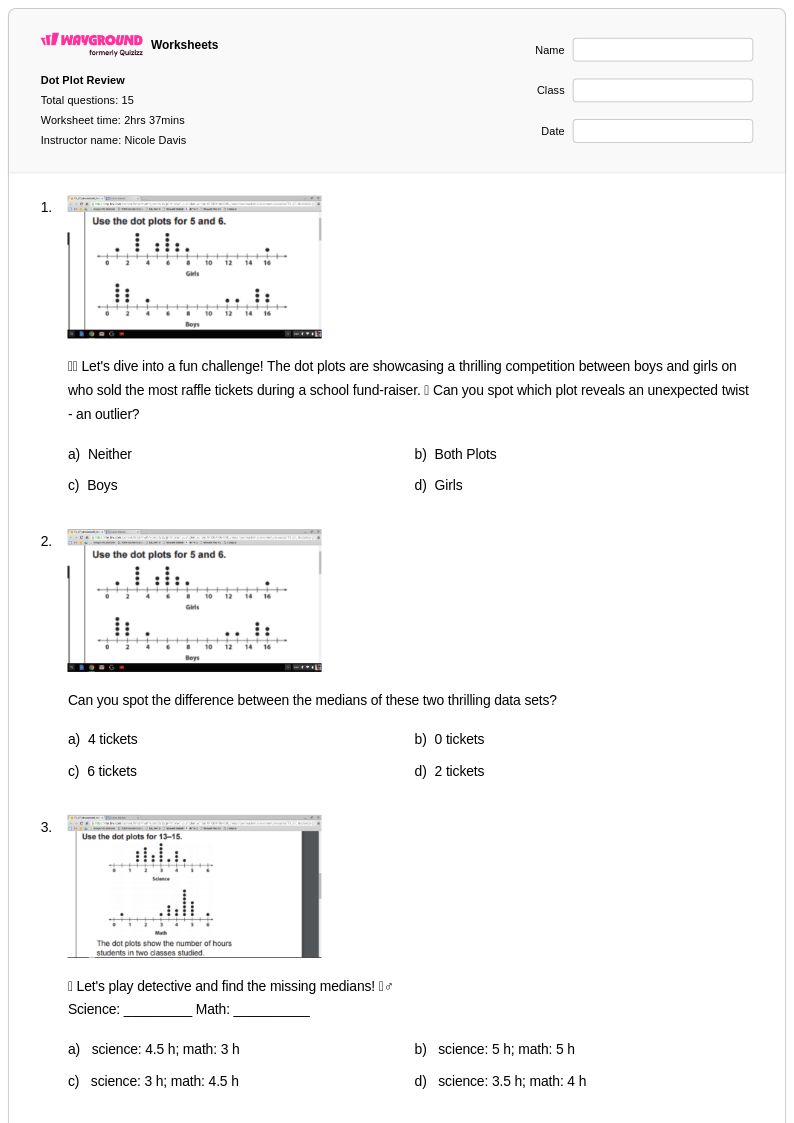
Dot plot worksheets available through Wayground (formerly Quizizz) provide students with essential practice in creating, reading, and interpreting this fundamental data visualization tool. These comprehensive worksheets strengthen critical mathematical skills including data collection, frequency analysis, distribution patterns, and statistical reasoning. Students work through carefully designed practice problems that progress from basic dot plot construction using simple datasets to more complex interpretations involving measures of center, variability, and comparative analysis. Each worksheet collection includes detailed answer keys and is available as free printable pdf resources, making them accessible for both classroom instruction and independent study. The practice problems are structured to build conceptual understanding while reinforcing procedural fluency in organizing and displaying numerical data effectively.
Wayground (formerly Quizizz) supports mathematics educators with millions of teacher-created dot plot worksheet resources that feature robust search and filtering capabilities to locate materials perfectly suited to specific learning objectives. The platform's standards-aligned collections ensure comprehensive coverage of data and graphing concepts while offering differentiation tools that accommodate diverse student needs and skill levels. Teachers can easily customize existing worksheets or create new ones, with flexible options for both printable pdf formats and interactive digital versions that enhance student engagement. These versatile resources streamline lesson planning while providing targeted support for remediation, enrichment, and systematic skill practice, enabling educators to effectively guide students through the essential process of understanding how dot plots reveal patterns, clusters, gaps, and outliers within datasets.