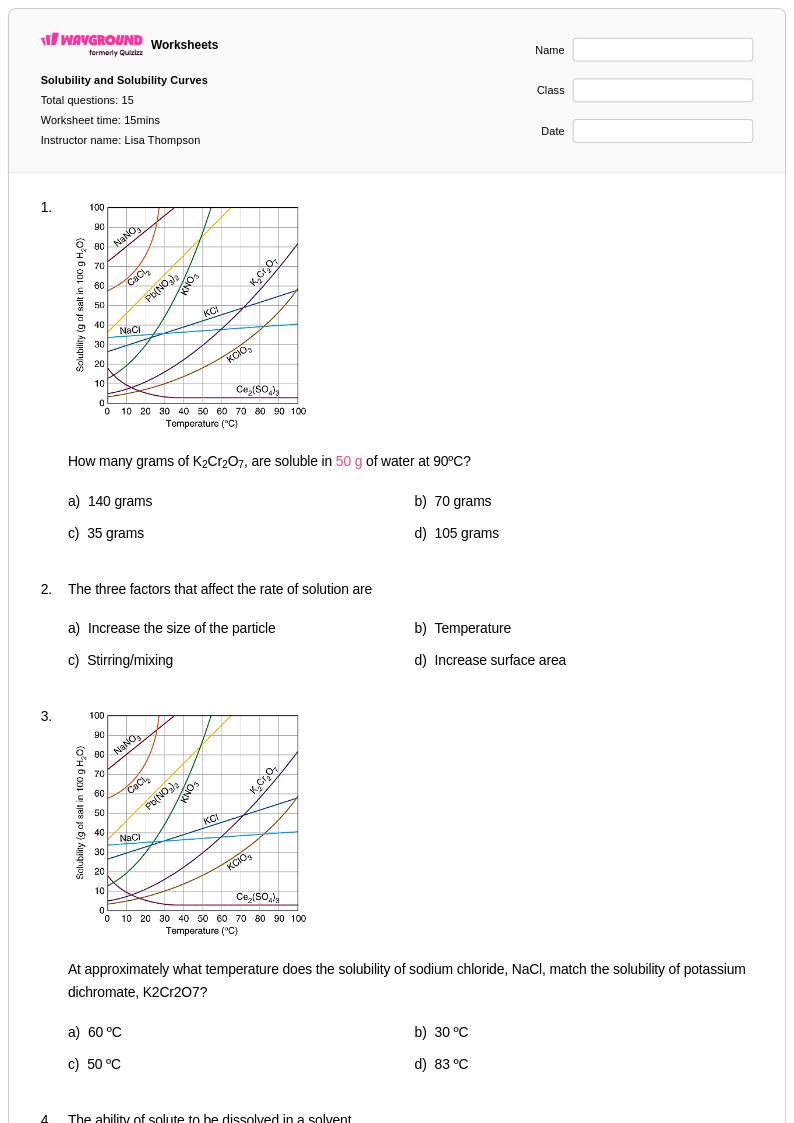
Free Printable Titration Curves Worksheets for Class 10
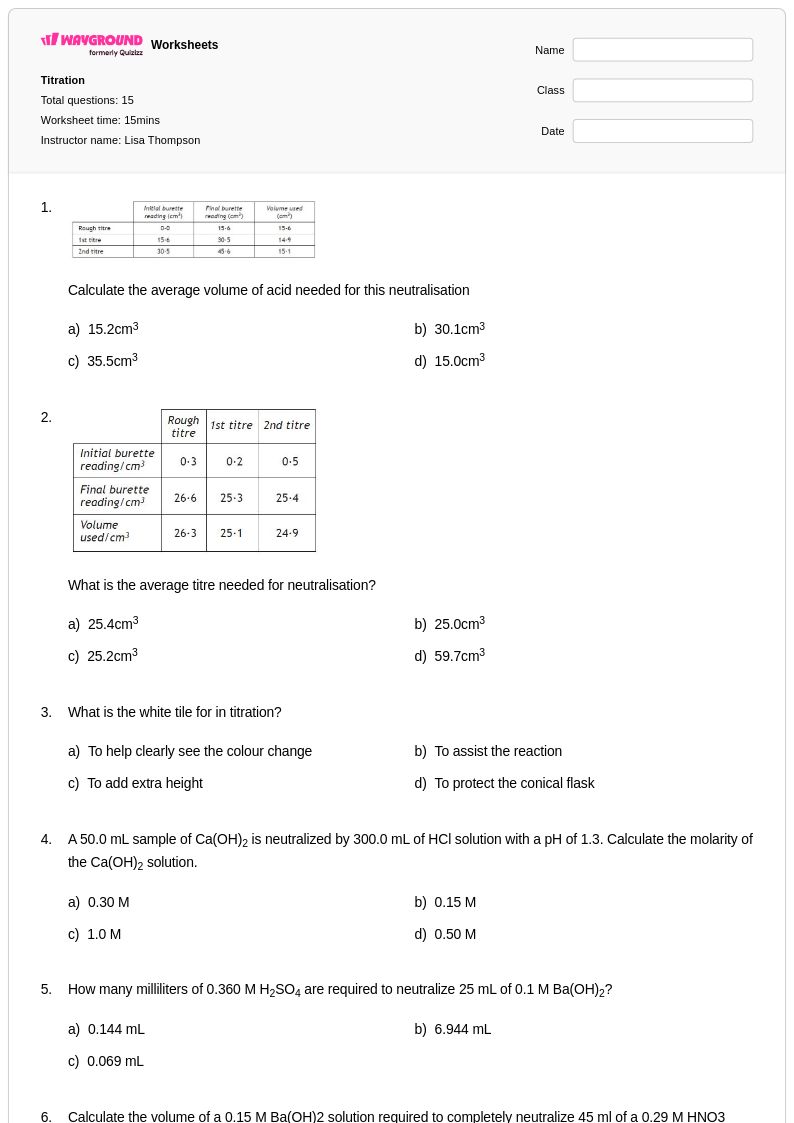
Explore Class 10 titration curves through Wayground's comprehensive collection of free worksheets and printables, featuring practice problems and answer keys to help students master acid-base titration analysis and interpretation.
Explore printable Titration Curves worksheets for Class 10
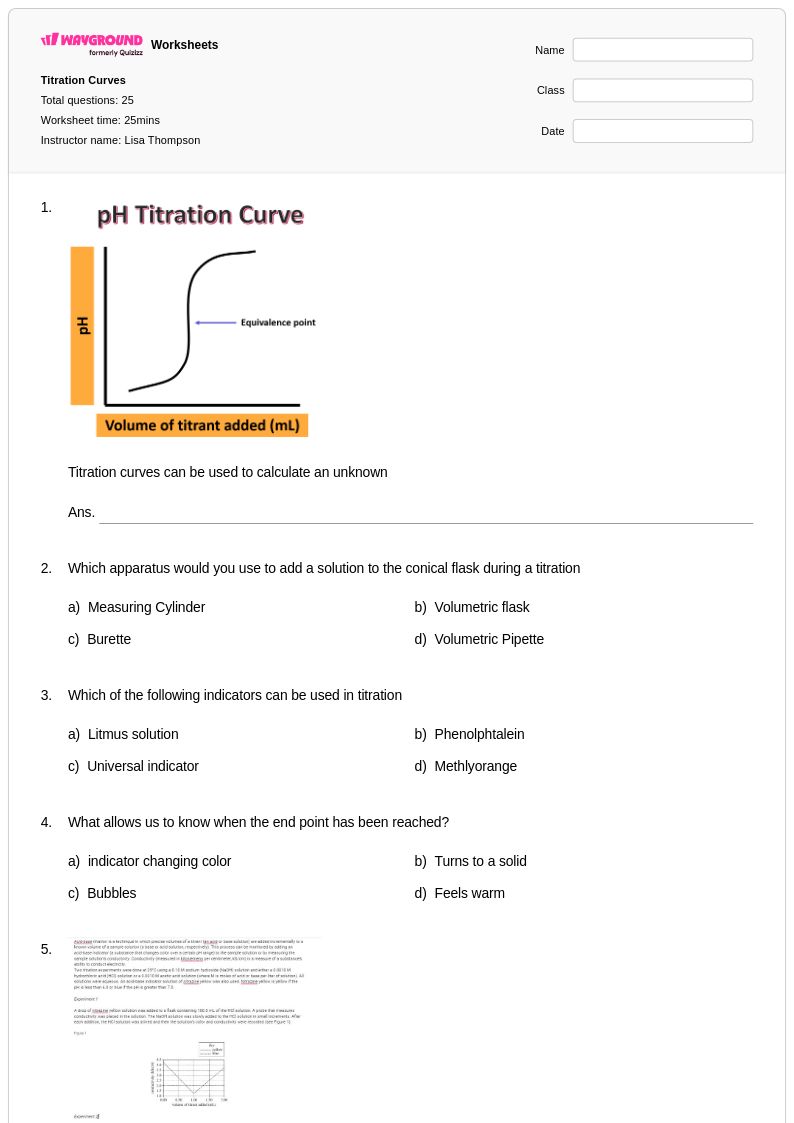
Titration curves represent a fundamental concept in Class 10 chemistry that bridges theoretical acid-base principles with practical laboratory applications. Wayground's comprehensive collection of titration curve worksheets provides students with essential practice in interpreting graphical data, identifying equivalence points, and understanding the relationship between pH changes and volume of titrant added during neutralization reactions. These carefully crafted resources strengthen critical analytical skills including graph interpretation, stoichiometric calculations, and the ability to predict and explain pH behavior throughout different stages of acid-base titrations. Students benefit from varied practice problems that range from strong acid-strong base scenarios to more complex weak acid-strong base systems, with complete answer keys available to support independent learning and immediate feedback on their understanding of these crucial electrochemical processes.
Wayground's extensive library of millions of teacher-created resources ensures educators have access to high-quality titration curve materials that align with chemistry curriculum standards and accommodate diverse learning needs in the Class 10 classroom. The platform's robust search and filtering capabilities allow teachers to quickly locate worksheets that target specific aspects of titration analysis, whether focusing on equivalence point identification, buffer region understanding, or indicator selection principles. These resources are available in both printable pdf formats for traditional classroom use and digital formats that support interactive learning environments, enabling seamless integration into lesson planning, homework assignments, and assessment preparation. The built-in differentiation tools and customization features empower educators to modify existing worksheets or create targeted practice materials for remediation and enrichment, ensuring that students at all proficiency levels can develop mastery of titration curve interpretation and related quantitative analysis skills.
FAQs
How do I teach titration curves in chemistry class?
Start by building students' understanding of acid-base equilibrium and pH before introducing the shape of a titration curve. Walk students through the four key regions of a curve: the initial pH, the buffer region, the equivalence point, and the region past equivalence. Using real or simulated titration data to plot curves by hand before interpreting pre-drawn ones helps students connect the chemistry to the graph's shape. Strong acid-strong base titrations are the best starting point before moving to weak acid-strong base or polyprotic systems.
What are the most common mistakes students make when interpreting titration curves?
The most frequent error is confusing the half-equivalence point with the equivalence point — students often mark the midpoint of the curve's steep rise rather than identifying where pH equals pKa. Many students also misread equivalence point pH as always being 7, not recognizing that weak acid-strong base titrations produce a basic equivalence point. A third common error is misidentifying the buffer region, particularly failing to recognize that buffering capacity is highest at the half-equivalence point where pH = pKa.
What practice problems help students get better at titration curve calculations?
Effective practice problems progress from reading and labeling pre-drawn curves to calculating pH at specific stages, including initial pH, half-equivalence point, equivalence point, and post-equivalence. Problems that require students to sketch their own curves from calculated pH values reinforce the connection between math and graphical interpretation. Including problems that span strong acid-strong base, weak acid-strong base, and polyprotic acid titrations ensures students can recognize how curve shape changes with system type.
How do titration curve worksheets help students prepare for AP Chemistry?
AP Chemistry requires students to both interpret and construct titration curves, identify buffer regions, and perform multi-step pH calculations involving Ka, Kb, and the Henderson-Hasselbalch equation. Worksheet practice that mirrors AP free-response formatting — where students must justify their reasoning alongside calculations — builds the analytical writing skills the exam demands. Regular practice with weak acid and polyprotic titration scenarios is especially important, as these appear frequently in AP assessments and require stronger conceptual fluency than strong acid problems.
How do I use Wayground's titration curves worksheets in my classroom?
Wayground's titration curves worksheets are available as printable PDFs for traditional classroom use and in digital formats for technology-integrated learning environments, including the option to host them as a graded quiz directly on Wayground. Teachers can select materials by complexity level, from basic curve-reading exercises to multi-step calculations involving weak acids and polyprotic systems, making it straightforward to differentiate instruction across a single class. All worksheets include detailed answer keys so students can self-check their work or teachers can use them for efficient grading.
How do I support struggling students who can't follow the math in titration curve problems?
Students who struggle with titration curve calculations often have gaps in logarithm fluency or acid-base equilibrium concepts rather than weaknesses specific to titration itself. Breaking the problem into discrete steps — write the balanced reaction, identify the species present at each stage, set up the ICE table or stoichiometry, then calculate pH — gives struggling students a repeatable scaffold. On Wayground, teachers can assign accommodations such as read-aloud support or reduced answer choices to individual students when using digital worksheet formats, lowering cognitive load without changing the rigor of the content for the rest of the class.