Free Printable Solubility Curves Worksheets for Class 10
Class 10 solubility curves worksheets from Wayground help students master interpreting and analyzing solubility data through engaging printables, practice problems, and comprehensive answer keys available as free PDF downloads.
Explore printable Solubility Curves worksheets for Class 10
Solubility curves represent a fundamental concept in Class 10 chemistry that helps students understand how temperature affects the dissolution of various substances in solvents. Wayground's comprehensive collection of solubility curves worksheets provides students with essential practice problems that develop their ability to interpret graphs, calculate solubility limits, and predict crystallization patterns. These carefully designed printables strengthen critical analytical skills including reading coordinate systems, determining saturation points, and understanding the relationship between temperature and solute concentration. Each worksheet comes with a detailed answer key that supports independent learning and allows students to verify their understanding of concepts such as supersaturation, precipitation, and the comparative solubility of different compounds across temperature ranges.
Wayground, formerly Quizizz, empowers chemistry teachers with access to millions of educator-created resources specifically focused on solubility curves and related chemical principles. The platform's advanced search and filtering capabilities allow instructors to quickly locate grade-appropriate materials that align with state and national science standards, while built-in differentiation tools enable seamless customization for students with varying ability levels. Teachers can access these resources in both digital and printable pdf formats, making them ideal for classroom instruction, homework assignments, remediation sessions, and enrichment activities. This flexibility streamlines lesson planning while ensuring that educators have high-quality materials to support skill practice, whether students need foundational support or advanced challenges in interpreting and applying solubility curve data.
FAQs
How do I teach students to read and interpret solubility curves?
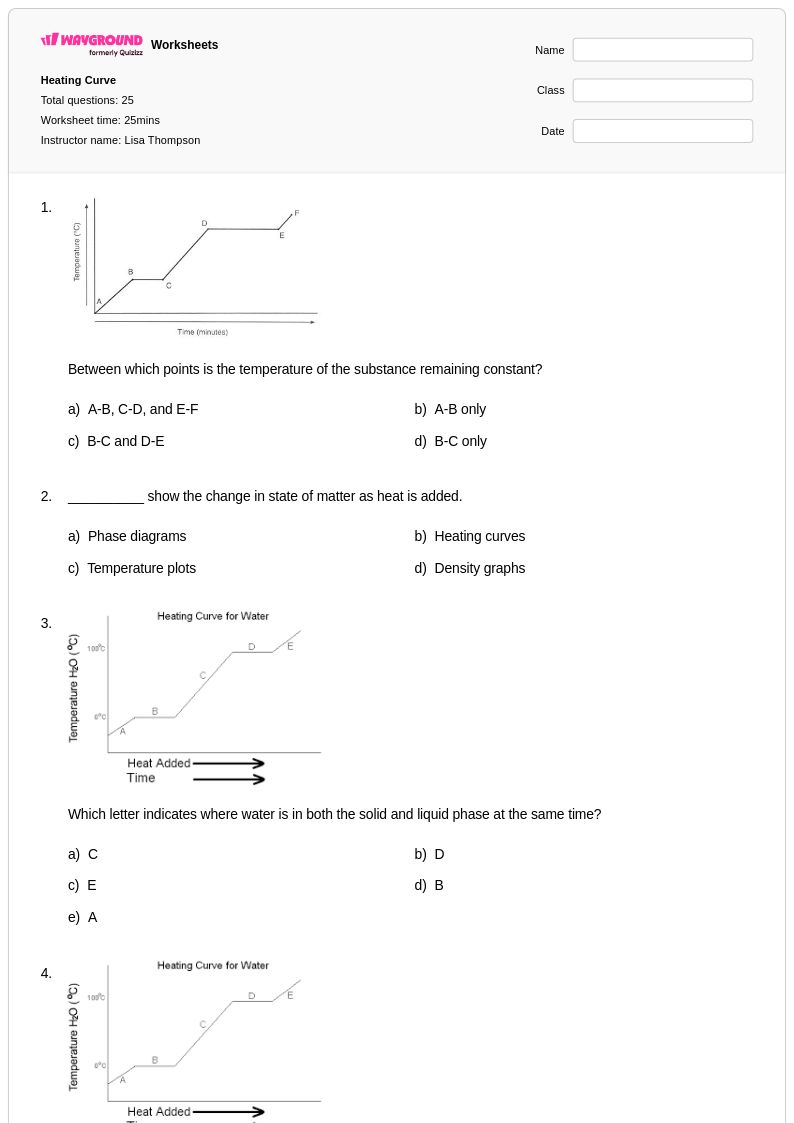
Start by ensuring students can identify the axes: temperature (x-axis) in degrees Celsius and solubility (y-axis) in grams of solute per 100g of water. Walk them through how to locate a specific temperature, trace upward to the curve for a given substance, and read across to find the maximum solubility at that temperature. Then introduce the concept of saturation zones — points above the curve represent supersaturated solutions, points below represent unsaturated solutions, and points directly on the curve represent saturated solutions. Using real solubility data for familiar substances like potassium nitrate and sodium chloride helps anchor these abstract relationships in concrete chemistry.
What practice problems should students work through to master solubility curves?
Effective practice should cover four core skill types: reading solubility values at specific temperatures, determining whether a solution is saturated, unsaturated, or supersaturated given a mass and temperature, calculating how much solute must be added or removed to shift saturation states, and predicting whether precipitation will occur when a solution is cooled. Problems that require students to compare two or more substances on the same graph build the additional skill of identifying which compounds are more temperature-sensitive, which is critical for understanding crystallization and real-world solution chemistry.
What mistakes do students commonly make when interpreting solubility curves?
The most common error is confusing the curve itself with the saturated zone — students often believe that any point on the curve means the solution is unsaturated, when in fact it represents exact saturation. A second frequent mistake is misreading the y-axis units: solubility is expressed per 100g of water, not per 100g of solution, and conflating these leads to incorrect mass calculations. Students also frequently misinterpret what happens when a saturated solution is cooled, failing to recognize that the excess solute will precipitate out rather than remain dissolved.
How do solubility curve worksheets help students prepare for chemistry lab work?
Solubility curve worksheets build the graph-reading and data interpretation skills students need before working with real solutions in a lab setting. By practicing how to predict saturation points and precipitation outcomes from graphical data, students arrive at lab with a conceptual framework for why solutions behave as they do when temperature changes. This preparation reduces procedural confusion during labs involving crystallization, recrystallization, or controlled precipitation, where misreading solubility relationships can compromise experimental results.
How can I use Wayground's solubility curves worksheets in my chemistry class?
Wayground's solubility curves worksheets are available as printable PDFs for traditional classroom use and in digital formats for technology-integrated or distance learning environments. Teachers can assign them as independent practice, homework, or pre-lab preparation, and can also host them as a quiz directly on Wayground to track student responses. Each worksheet includes a complete answer key, supporting self-assessment and reducing grading time. Wayground also allows teachers to apply student-level accommodations such as extended time or read-aloud support for individual students without disrupting the rest of the class.
How do I differentiate solubility curve instruction for students at different levels?
For struggling students, begin with single-substance graphs and limit questions to direct reading tasks before introducing saturation comparisons or precipitation predictions. Advanced students can be challenged with multi-substance graphs, reverse-calculation problems (e.g., finding the temperature at which a given mass becomes exactly saturated), and application scenarios involving lab design. On Wayground, teachers can assign differentiated versions of the same worksheet and apply individual accommodations such as reduced answer choices or extended time to specific students, keeping instruction cohesive while addressing a range of proficiency levels.